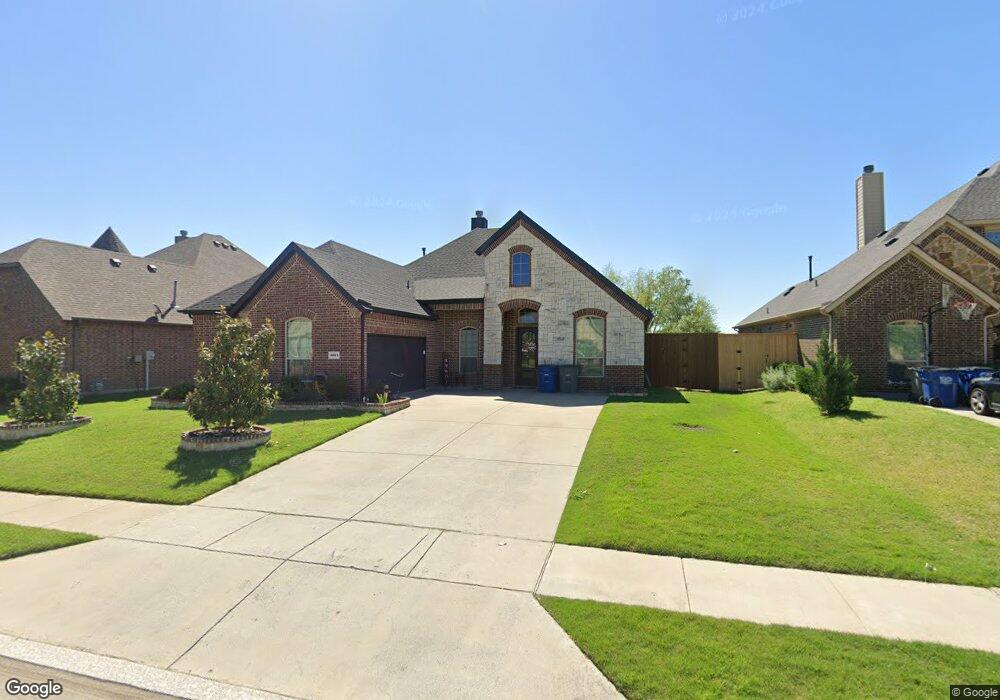
3614 Harlan Dr Sachse, TX 75048
Estimated Value: $523,000 - $546,872
4
Beds
2
Baths
2,409
Sq Ft
$223/Sq Ft
Est. Value
About This Home
This home is located at 3614 Harlan Dr, Sachse, TX 75048 and is currently estimated at $538,218, approximately $223 per square foot. 3614 Harlan Dr is a home located in Collin County with nearby schools including Don Whitt Elementary School, Dr. Al Draper Intermediate Middle School, and Raymond B Cooper J High School.
Ownership History
Date
Name
Owned For
Owner Type
Purchase Details
Closed on
Jul 17, 2023
Sold by
Pauling Bucky Don and Pauling Melissa Jo
Bought by
Bm Pauling Revocable Trust and Pauling
Current Estimated Value
Purchase Details
Closed on
Sep 5, 2020
Sold by
Mendoza Stefanie and Mendoza Thomas
Bought by
Sph Property One Llc
Purchase Details
Closed on
Dec 10, 2019
Sold by
Sph Property One Llc
Bought by
Pauling Melissa Jo and Pauling Bucky Don
Home Financials for this Owner
Home Financials are based on the most recent Mortgage that was taken out on this home.
Original Mortgage
$285,400
Interest Rate
3.3%
Mortgage Type
New Conventional
Purchase Details
Closed on
Mar 30, 2015
Sold by
D R Horton Inc Texas Ltd
Bought by
Mendoza Stefanie and Mendoza Thomas
Home Financials for this Owner
Home Financials are based on the most recent Mortgage that was taken out on this home.
Original Mortgage
$282,796
Interest Rate
4.5%
Mortgage Type
FHA
Create a Home Valuation Report for This Property
The Home Valuation Report is an in-depth analysis detailing your home's value as well as a comparison with similar homes in the area
Home Values in the Area
Average Home Value in this Area
Purchase History
| Date | Buyer | Sale Price | Title Company |
|---|---|---|---|
| Bm Pauling Revocable Trust | -- | None Listed On Document | |
| Sph Property One Llc | -- | None Available | |
| Pauling Melissa Jo | -- | Fidelity Title | |
| Mendoza Stefanie | -- | None Available |
Source: Public Records
Mortgage History
| Date | Status | Borrower | Loan Amount |
|---|---|---|---|
| Previous Owner | Pauling Melissa Jo | $285,400 | |
| Previous Owner | Mendoza Stefanie | $282,796 |
Source: Public Records
Tax History Compared to Growth
Tax History
| Year | Tax Paid | Tax Assessment Tax Assessment Total Assessment is a certain percentage of the fair market value that is determined by local assessors to be the total taxable value of land and additions on the property. | Land | Improvement |
|---|---|---|---|---|
| 2025 | $8,314 | $508,003 | $140,000 | $399,487 |
| 2024 | $8,314 | $461,821 | $140,000 | $423,132 |
| 2023 | $8,314 | $419,837 | $140,000 | $378,604 |
| 2022 | $8,710 | $381,670 | $120,000 | $337,894 |
| 2021 | $8,362 | $346,973 | $85,000 | $261,973 |
| 2020 | $7,963 | $316,668 | $85,000 | $231,668 |
| 2019 | $8,707 | $332,079 | $85,000 | $247,079 |
| 2018 | $8,394 | $315,649 | $85,000 | $230,649 |
| 2017 | $8,083 | $303,933 | $75,000 | $228,933 |
| 2016 | $7,426 | $276,396 | $75,000 | $201,396 |
| 2015 | $885 | $136,353 | $65,000 | $71,353 |
Source: Public Records
Map
Nearby Homes
- 3604 Texas Dr
- 7213 Bronco Bluff
- 7114 Running Iron Trail
- 3206 Creekside Dr
- 7309 Parkwood Dr
- 4125 Caprock Canyon Rd
- 3521 Meadowside Dr
- 3117 Tina St
- 3320 Bryan St
- 4007 William St
- 3818 Missouri St
- 6925 Dewitt Rd
- 3910 7th St
- 3320 Salmon St
- 7706 Paddock Trail
- 3324 Salmon St
- 6315 Sachse St
- 3917 Lillie St
- 6802 Vicuna Cir
- 5937 Boone St
- 3618 Harlan Dr
- 3610 Harlan Dr
- 3606 Harlan Dr
- 3620 Harlan Dr
- 3615 Harlan Dr
- 3619 Harlan Dr
- 3609 Harlan Dr
- 3602 Harlan Dr
- 3624 Harlan Dr
- 3621 Harlan Dr
- 3525 Harlan Dr
- 3522 Harlan Dr
- 7016 Samarth Ln
- 3626 Harlan Dr
- 7014 Samarth Ln
- 3521 Harlan Dr
- 7012 Samarth Ln
- 3622 Mohan Ct
- 3520 Harlan Dr
- 3612 Mohan Ct