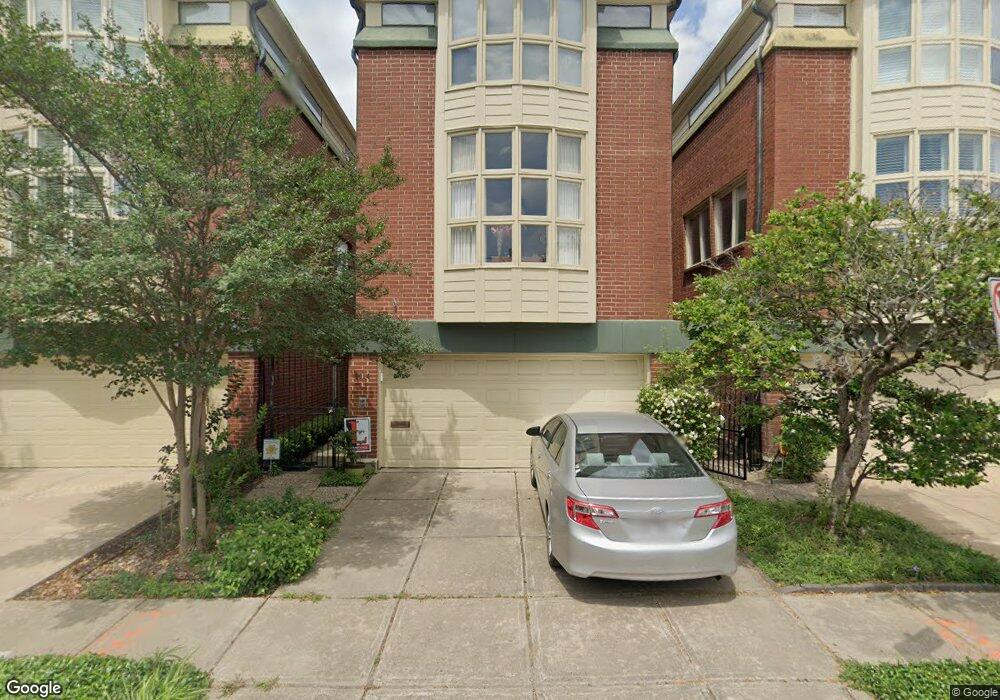
3614 Mulberry St Houston, TX 77006
Montrose NeighborhoodEstimated Value: $417,010 - $542,000
2
Beds
2
Baths
1,766
Sq Ft
$274/Sq Ft
Est. Value
About This Home
This home is located at 3614 Mulberry St, Houston, TX 77006 and is currently estimated at $483,503, approximately $273 per square foot. 3614 Mulberry St is a home located in Harris County with nearby schools including Baker Montessori, Lanier Middle School, and Lamar High School.
Ownership History
Date
Name
Owned For
Owner Type
Purchase Details
Closed on
Aug 2, 2021
Sold by
Morrell David N
Bought by
Morrell David N and Emerick Shannon E
Current Estimated Value
Purchase Details
Closed on
Jun 15, 2016
Sold by
Owens Gary S and Owens Luana
Bought by
Morrell David M
Home Financials for this Owner
Home Financials are based on the most recent Mortgage that was taken out on this home.
Original Mortgage
$274,500
Interest Rate
3.61%
Mortgage Type
New Conventional
Purchase Details
Closed on
May 21, 2013
Sold by
Kelly Brian T and Kelly Claude S
Bought by
Owens Gary S and Owens Luana M Jones
Home Financials for this Owner
Home Financials are based on the most recent Mortgage that was taken out on this home.
Original Mortgage
$121,000
Interest Rate
3.56%
Mortgage Type
New Conventional
Purchase Details
Closed on
May 20, 2013
Sold by
Kelly Brian T and Kelly Claude S
Bought by
Owens Gary S and Owens Luana M Jones
Home Financials for this Owner
Home Financials are based on the most recent Mortgage that was taken out on this home.
Original Mortgage
$121,000
Interest Rate
3.56%
Mortgage Type
New Conventional
Purchase Details
Closed on
Dec 30, 2008
Sold by
Kelly Timothy E and Kelly Virginia J
Bought by
Kelly Brian T
Home Financials for this Owner
Home Financials are based on the most recent Mortgage that was taken out on this home.
Original Mortgage
$41,000
Interest Rate
4.91%
Mortgage Type
Seller Take Back
Purchase Details
Closed on
Mar 3, 2008
Sold by
Mcneill Leland Rhine
Bought by
Kelly Brian T and Kelly Timothy E
Home Financials for this Owner
Home Financials are based on the most recent Mortgage that was taken out on this home.
Original Mortgage
$216,000
Interest Rate
5.47%
Mortgage Type
Purchase Money Mortgage
Purchase Details
Closed on
Mar 27, 2002
Sold by
Mcneil Family Lp
Bought by
Mcneill Leland Rhine
Home Financials for this Owner
Home Financials are based on the most recent Mortgage that was taken out on this home.
Original Mortgage
$196,000
Interest Rate
5.27%
Mortgage Type
Credit Line Revolving
Purchase Details
Closed on
Jun 26, 1996
Sold by
Pearson Bennett L
Bought by
Mcneill Leland Rhine
Home Financials for this Owner
Home Financials are based on the most recent Mortgage that was taken out on this home.
Original Mortgage
$144,900
Interest Rate
8.62%
Purchase Details
Closed on
Mar 29, 1996
Sold by
Edwards Lavon Smith and Smith Charles W
Bought by
Pearson Benett L
Create a Home Valuation Report for This Property
The Home Valuation Report is an in-depth analysis detailing your home's value as well as a comparison with similar homes in the area
Home Values in the Area
Average Home Value in this Area
Purchase History
| Date | Buyer | Sale Price | Title Company |
|---|---|---|---|
| Morrell David N | -- | None Listed On Document | |
| Morrell David M | -- | None Available | |
| Owens Gary S | -- | Chicago Title | |
| Owens Gary S | -- | Chicago Title | |
| Kelly Brian T | -- | None Available | |
| Kelly Brian T | -- | Startex Title Company | |
| Mcneill Leland Rhine | -- | Houston Title Company | |
| Mcneill Leland Rhine | -- | American Title Co | |
| Pearson Benett L | -- | Stewart Title Company |
Source: Public Records
Mortgage History
| Date | Status | Borrower | Loan Amount |
|---|---|---|---|
| Previous Owner | Morrell David M | $274,500 | |
| Previous Owner | Owens Gary S | $121,000 | |
| Previous Owner | Owens Gary S | $121,000 | |
| Previous Owner | Kelly Brian T | $41,000 | |
| Previous Owner | Kelly Brian T | $216,000 | |
| Previous Owner | Mcneill Leland Rhine | $196,000 | |
| Previous Owner | Mcneill Leland Rhine | $144,900 |
Source: Public Records
Tax History Compared to Growth
Tax History
| Year | Tax Paid | Tax Assessment Tax Assessment Total Assessment is a certain percentage of the fair market value that is determined by local assessors to be the total taxable value of land and additions on the property. | Land | Improvement |
|---|---|---|---|---|
| 2025 | $5,407 | $317,343 | $150,150 | $167,193 |
| 2024 | $5,407 | $374,271 | $150,150 | $224,121 |
| 2023 | $5,407 | $376,848 | $150,150 | $226,698 |
| 2022 | $7,685 | $349,020 | $122,850 | $226,170 |
| 2021 | $8,251 | $354,000 | $143,325 | $210,675 |
| 2020 | $8,535 | $352,439 | $130,750 | $221,689 |
| 2019 | $9,391 | $371,110 | $104,600 | $266,510 |
| 2018 | $8,977 | $355,341 | $104,600 | $250,741 |
| 2017 | $9,429 | $355,341 | $104,600 | $250,741 |
| 2016 | $9,429 | $355,341 | $104,600 | $250,741 |
| 2015 | $6,234 | $355,341 | $104,600 | $250,741 |
| 2014 | $6,234 | $310,251 | $91,525 | $218,726 |
Source: Public Records
Map
Nearby Homes
- 1517 Kipling St
- 1511 Kipling St
- 1507 Kipling St
- 1510 Marshall St
- 1531 Marshall St Unit 3
- 1503 Harold St
- 3705 Mandell St Unit 8
- 1512 W Alabama St
- 1612 Kipling St
- 1612 W Alabama St Unit ABCD
- 1620 Harold St
- 3540 Yupon St
- 1634 Marshall St
- 3515 Yupon St
- 1638 W Alabama St
- 1539 Westheimer Rd
- 1660 Kipling St
- 3403 Yupon St
- 1640 Sul Ross St
- 1621 California St
- 3612 Mulberry St
- 3612 Mulberry St
- 3610 Mulberry St
- 1508 Marshall St
- 3608 Mulberry St
- 3606 Mulberry St
- 3623 Mulberry St
- 1426 Marshall St
- 3619 Mulberry St
- 1501 Marshall St
- 11935 Mulberry St
- 1514 Marshall St
- 1501 Kipling St
- 1424 Marshall St Unit 9
- 1424 Marshall St Unit 1
- 1424 Marshall St
- 1505 Kipling St Unit 1505 no.2
- 1505 Kipling St
- 1507 Marshall St
- 1425 Kipling St