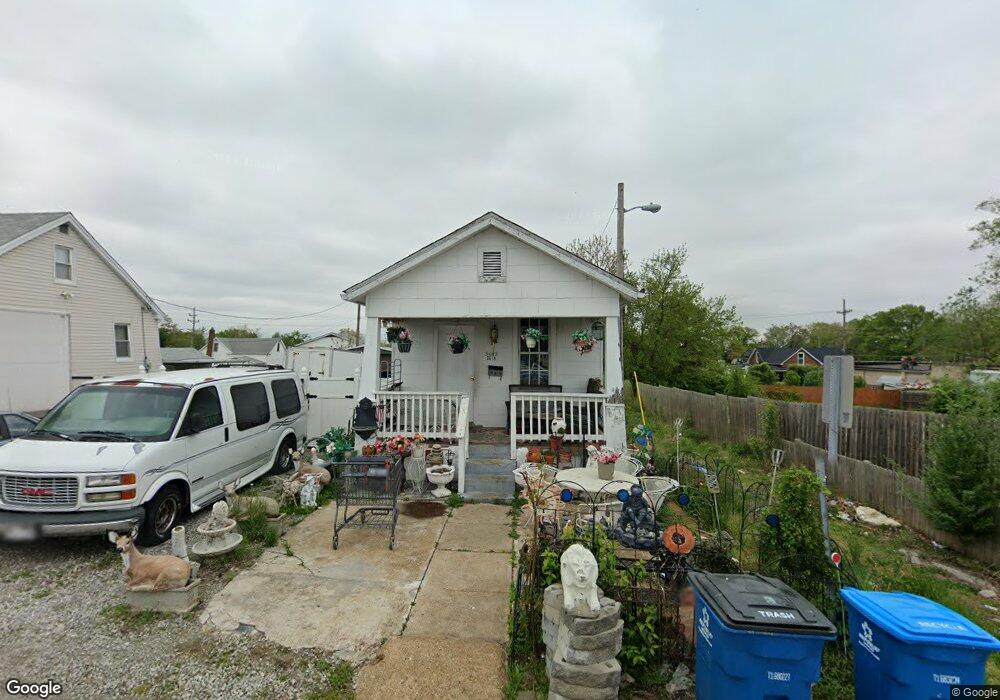
3615 Bobring Ave Saint Louis, MO 63125
Lemay NeighborhoodEstimated Value: $100,000 - $117,064
2
Beds
1
Bath
615
Sq Ft
$180/Sq Ft
Est. Value
About This Home
This home is located at 3615 Bobring Ave, Saint Louis, MO 63125 and is currently estimated at $110,766, approximately $180 per square foot. 3615 Bobring Ave is a home located in St. Louis County with nearby schools including Bayless Elementary School, Bayless Junior High School, and Bayless Senior High School.
Ownership History
Date
Name
Owned For
Owner Type
Purchase Details
Closed on
Jan 8, 2014
Sold by
Secretary Of Housing & Urban Development
Bought by
Suljic Zeka
Current Estimated Value
Purchase Details
Closed on
Oct 31, 2012
Sold by
Bank Of America Na
Bought by
Secretary Of Housing & Urban Development
Purchase Details
Closed on
Oct 24, 2012
Sold by
Stephanie A
Bought by
Bank Of America Na
Purchase Details
Closed on
Jan 9, 2003
Sold by
Stephanie A
Bought by
Null Richard L
Purchase Details
Closed on
Oct 8, 2002
Sold by
Null Richard L
Bought by
Stephanie A
Home Financials for this Owner
Home Financials are based on the most recent Mortgage that was taken out on this home.
Original Mortgage
$15,000
Interest Rate
5.86%
Mortgage Type
Unknown
Purchase Details
Closed on
Jun 26, 2002
Sold by
Brummel Gary R
Bought by
Null Richard L
Home Financials for this Owner
Home Financials are based on the most recent Mortgage that was taken out on this home.
Original Mortgage
$30,000
Interest Rate
6.89%
Create a Home Valuation Report for This Property
The Home Valuation Report is an in-depth analysis detailing your home's value as well as a comparison with similar homes in the area
Home Values in the Area
Average Home Value in this Area
Purchase History
| Date | Buyer | Sale Price | Title Company |
|---|---|---|---|
| Suljic Zeka | $11,150 | Investors Title Co Clayton | |
| Secretary Of Housing & Urban Development | -- | None Available | |
| Bank Of America Na | $106,810 | None Available | |
| Null Richard L | -- | -- | |
| Stephanie A | -- | -- | |
| Null Richard L | $38,500 | -- |
Source: Public Records
Mortgage History
| Date | Status | Borrower | Loan Amount |
|---|---|---|---|
| Previous Owner | Stephanie A | $15,000 | |
| Previous Owner | Null Richard L | $30,000 | |
| Closed | Null Richard L | $15,000 | |
| Closed | Stephanie A | $30,000 |
Source: Public Records
Tax History Compared to Growth
Tax History
| Year | Tax Paid | Tax Assessment Tax Assessment Total Assessment is a certain percentage of the fair market value that is determined by local assessors to be the total taxable value of land and additions on the property. | Land | Improvement |
|---|---|---|---|---|
| 2025 | $1,210 | $22,120 | $14,650 | $7,470 |
| 2024 | $1,210 | $16,510 | $7,810 | $8,700 |
| 2023 | $1,150 | $16,510 | $7,810 | $8,700 |
| 2022 | $1,039 | $13,430 | $7,810 | $5,620 |
| 2021 | $1,023 | $13,430 | $7,810 | $5,620 |
| 2020 | $1,031 | $12,590 | $7,710 | $4,880 |
| 2019 | $1,028 | $12,590 | $7,710 | $4,880 |
| 2018 | $800 | $8,570 | $5,780 | $2,790 |
| 2017 | $755 | $8,570 | $5,780 | $2,790 |
| 2016 | $644 | $6,940 | $3,880 | $3,060 |
| 2015 | $640 | $6,940 | $3,880 | $3,060 |
| 2014 | -- | $6,080 | $3,170 | $2,910 |
Source: Public Records
Map
Nearby Homes
- 944 Regina Ave
- 1408 Dammert Ave
- 527 Hoffmeister Ave
- 765 Pardella Ave Unit A
- 320 Degenhardt Ave
- 437 Hoffmeister Ave
- 311 Degenhardt Ave
- 9723 Gentry Ave
- 333 Rauhut Ave
- 331 Rauhut Ave
- 522 Lagro Ave
- 363 Hoffmeister Ave
- 4048 Paule Ave Unit 4048
- 735 Dammert Ave
- 715 Erskine Ave
- 720 Erskine Ave
- 4084 Paule Ave
- 711 Erskine Ave
- 4013 Birchwood Place
- 115 W Cartwright Ave
- 3621 Bobring Ave
- 3627 Bobring Ave
- 1013 Lemay Ferry Rd
- 3620 Paule Ave
- 1009 Lemay Ferry Rd
- 3624 Paule Ave
- 3616 Paule Ave
- 3626 Paule Ave
- 1001 Lemay Ferry Rd
- 1001 Lemay Ferry Rd Unit None
- 3701 Bobring Ave
- 3703 Bobring Ave
- 3700 Paule Ave
- 3702 Bobring Ave
- 3705 Bobring Ave
- 3704 Bobring Ave
- 3621 Paule Ave
- 3706 Paule Ave
- 3617 Paule Ave
- 3627 Paule Ave