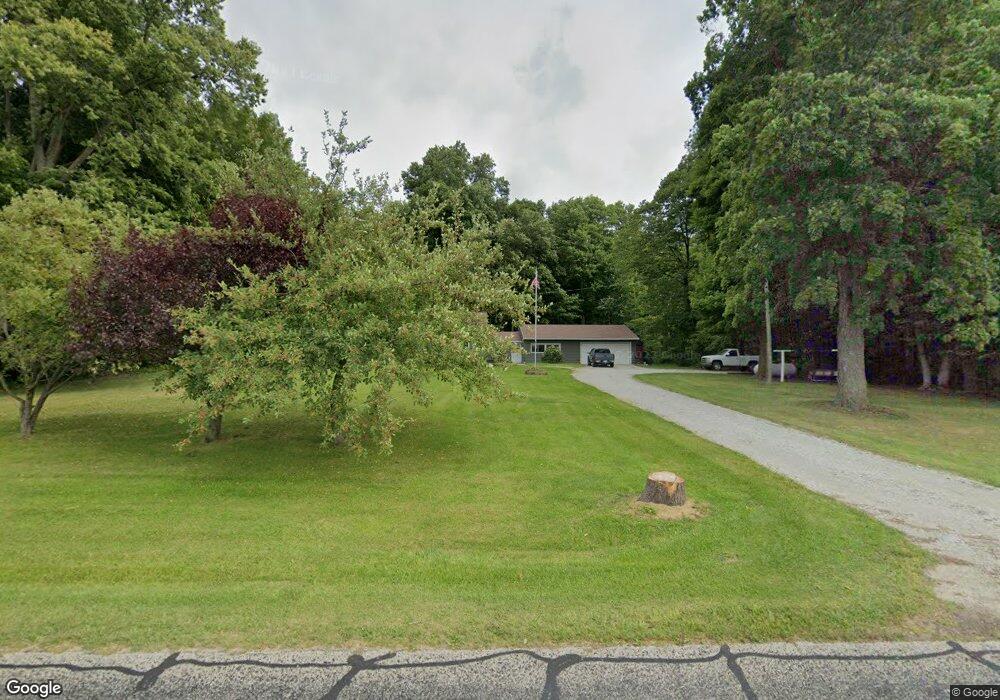
3615 E Baseline Rd Albion, IN 46701
Estimated Value: $216,007 - $275,000
2
Beds
1
Bath
1,148
Sq Ft
$217/Sq Ft
Est. Value
About This Home
This home is located at 3615 E Baseline Rd, Albion, IN 46701 and is currently estimated at $249,252, approximately $217 per square foot. 3615 E Baseline Rd is a home located in Noble County with nearby schools including Central Noble Jr. - Sr. High School.
Ownership History
Date
Name
Owned For
Owner Type
Purchase Details
Closed on
Oct 29, 2021
Sold by
Buchanan Tosha N
Bought by
England Homer B and England Fulk M
Current Estimated Value
Purchase Details
Closed on
Aug 18, 2017
Sold by
Higginbotham Billie A
Bought by
Buchanan Tosha N
Purchase Details
Closed on
Apr 2, 2013
Sold by
John Ananias Estate
Bought by
Tommie Higginbotham and Billie Higginbotham
Create a Home Valuation Report for This Property
The Home Valuation Report is an in-depth analysis detailing your home's value as well as a comparison with similar homes in the area
Purchase History
| Date | Buyer | Sale Price | Title Company |
|---|---|---|---|
| England Homer B | $153,000 | Assurance Title Company Llc | |
| Buchanan Tosha N | $102,500 | Attorney Only | |
| Tommie Higginbotham | $70,000 | Assurance Title Company |
Source: Public Records
Mortgage History
| Date | Status | Borrower | Loan Amount |
|---|---|---|---|
| Closed | Buchanan Tosha N | $82,000 |
Source: Public Records
Tax History
| Year | Tax Paid | Tax Assessment Tax Assessment Total Assessment is a certain percentage of the fair market value that is determined by local assessors to be the total taxable value of land and additions on the property. | Land | Improvement |
|---|---|---|---|---|
| 2025 | $966 | $205,000 | $26,600 | $178,400 |
| 2024 | $966 | $193,100 | $26,600 | $166,500 |
| 2023 | $981 | $188,000 | $25,600 | $162,400 |
| 2022 | $957 | $184,900 | $25,600 | $159,300 |
| 2021 | $571 | $132,800 | $22,200 | $110,600 |
| 2020 | $610 | $128,600 | $20,600 | $108,000 |
| 2019 | $562 | $124,000 | $20,500 | $103,500 |
| 2018 | $541 | $119,600 | $19,700 | $99,900 |
| 2017 | $514 | $115,900 | $17,100 | $98,800 |
| 2016 | $1,520 | $113,100 | $17,100 | $96,000 |
| 2014 | $1,382 | $105,700 | $17,100 | $88,600 |
Source: Public Records
Map
Nearby Homes
Your Personal Tour Guide
Ask me questions while you tour the home.