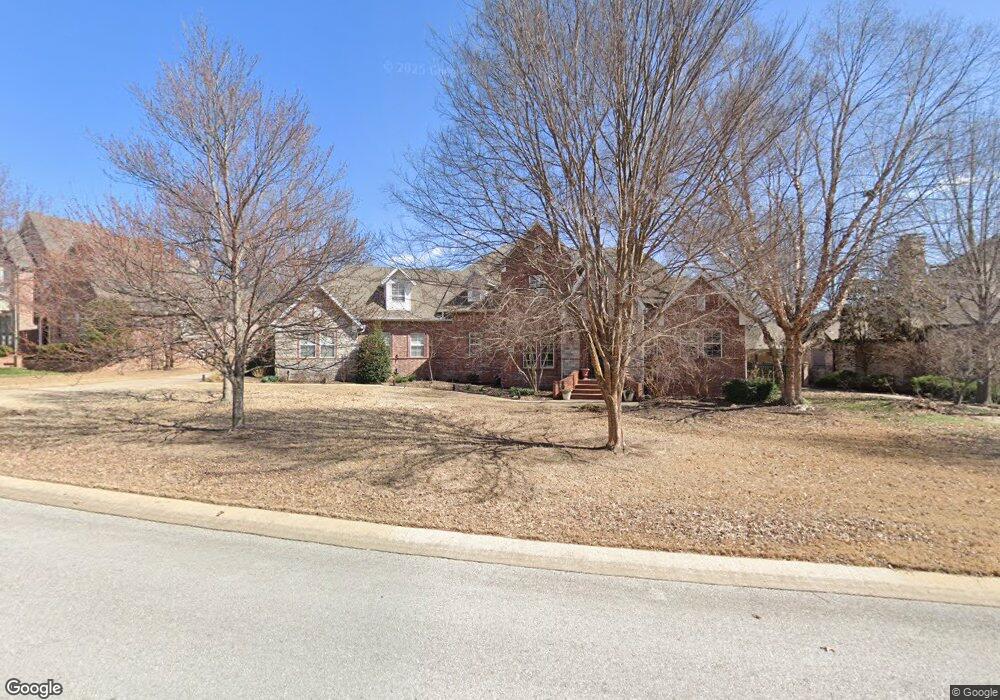
3615 Laural Ridge Springdale, AR 72764
Estimated Value: $746,102 - $861,000
4
Beds
4
Baths
3,812
Sq Ft
$215/Sq Ft
Est. Value
About This Home
This home is located at 3615 Laural Ridge, Springdale, AR 72764 and is currently estimated at $821,026, approximately $215 per square foot. 3615 Laural Ridge is a home located in Benton County with nearby schools including Hunt Elementary School, Central Junior High School, and Hellstern Middle School.
Ownership History
Date
Name
Owned For
Owner Type
Purchase Details
Closed on
Mar 26, 2009
Sold by
Parks Arthur L and Parks Melissa R
Bought by
Shanks Stephen and Shanks Counts
Current Estimated Value
Home Financials for this Owner
Home Financials are based on the most recent Mortgage that was taken out on this home.
Original Mortgage
$362,000
Interest Rate
5.16%
Mortgage Type
Purchase Money Mortgage
Purchase Details
Closed on
Nov 22, 2005
Sold by
Marino Robert M and Marino Julie L
Bought by
Park Arthur L and Parks Melissa R
Home Financials for this Owner
Home Financials are based on the most recent Mortgage that was taken out on this home.
Original Mortgage
$433,000
Interest Rate
6.12%
Mortgage Type
New Conventional
Purchase Details
Closed on
Sep 27, 1999
Bought by
Marino
Purchase Details
Closed on
Jan 25, 1999
Bought by
Elder Const
Create a Home Valuation Report for This Property
The Home Valuation Report is an in-depth analysis detailing your home's value as well as a comparison with similar homes in the area
Home Values in the Area
Average Home Value in this Area
Purchase History
| Date | Buyer | Sale Price | Title Company |
|---|---|---|---|
| Shanks Stephen | $444,000 | Realty Title & Closing Servi | |
| Park Arthur L | $433,000 | Elite Title Company Inc | |
| Marino | $350,000 | -- | |
| Elder Const | $48,000 | -- |
Source: Public Records
Mortgage History
| Date | Status | Borrower | Loan Amount |
|---|---|---|---|
| Closed | Shanks Stephen | $362,000 | |
| Previous Owner | Park Arthur L | $433,000 |
Source: Public Records
Tax History Compared to Growth
Tax History
| Year | Tax Paid | Tax Assessment Tax Assessment Total Assessment is a certain percentage of the fair market value that is determined by local assessors to be the total taxable value of land and additions on the property. | Land | Improvement |
|---|---|---|---|---|
| 2025 | $5,071 | $129,478 | $24,000 | $105,478 |
| 2024 | $4,952 | $129,478 | $24,000 | $105,478 |
| 2023 | $4,716 | $88,480 | $15,200 | $73,280 |
| 2022 | $4,275 | $88,480 | $15,200 | $73,280 |
| 2021 | $4,046 | $88,480 | $15,200 | $73,280 |
| 2020 | $3,844 | $79,160 | $12,800 | $66,360 |
| 2019 | $3,844 | $79,160 | $12,800 | $66,360 |
| 2018 | $3,869 | $79,160 | $12,800 | $66,360 |
| 2017 | $3,869 | $79,160 | $12,800 | $66,360 |
| 2016 | $3,869 | $79,160 | $12,800 | $66,360 |
| 2015 | $4,196 | $78,730 | $10,000 | $68,730 |
| 2014 | $3,846 | $78,730 | $10,000 | $68,730 |
Source: Public Records
Map
Nearby Homes
- 3800 Tanglewood Dr
- 3098 Sagely Ln
- 4210 Essex Cove
- 1483 Leesburg Ave
- 1859 Lancaster Dr
- 1308 W Stultz Rd
- 3450 Pasofino Loop
- 1376 Lexington Cir
- 2122 Wagon Wheel Rd
- 7.25 AC Thompson
- 4654 Carriage Ln
- 4661 Carriage Ln
- 3453 Knox Loop
- 3038 Cherry Knoll Cir
- 3497 Eaglecrest Cir
- 0 Graham Rd
- 1719 Wensworth Ave
- Justin Plan at Nature Walk
- Cali Plan at Nature Walk
- Garfield Plan at Nature Walk
- 3615 Laurel Ridge Dr
- 3615 Laurel Ridge
- 3581 Laural Ridge
- 3643 Laural Ridge
- 3670 Tanglewood Dr
- 3558 Tanglewood Dr
- 3652 Tanglewood Dr
- 3632 Laural Ridge
- 3671 Laural Ridge
- 3608 Laural Ridge
- 3608 Tanglewood Dr
- 3576 Laural Ridge
- 3654 Laural Ridge
- 3534 Laural Ridge
- 3697 Laurel Ridge
- 3697 Laurel Ridge St
- 3712 Tanglewood Dr
- 3697 Laural Ridge
- 3680 Laurel Ridge
- 3680 Laural Ridge