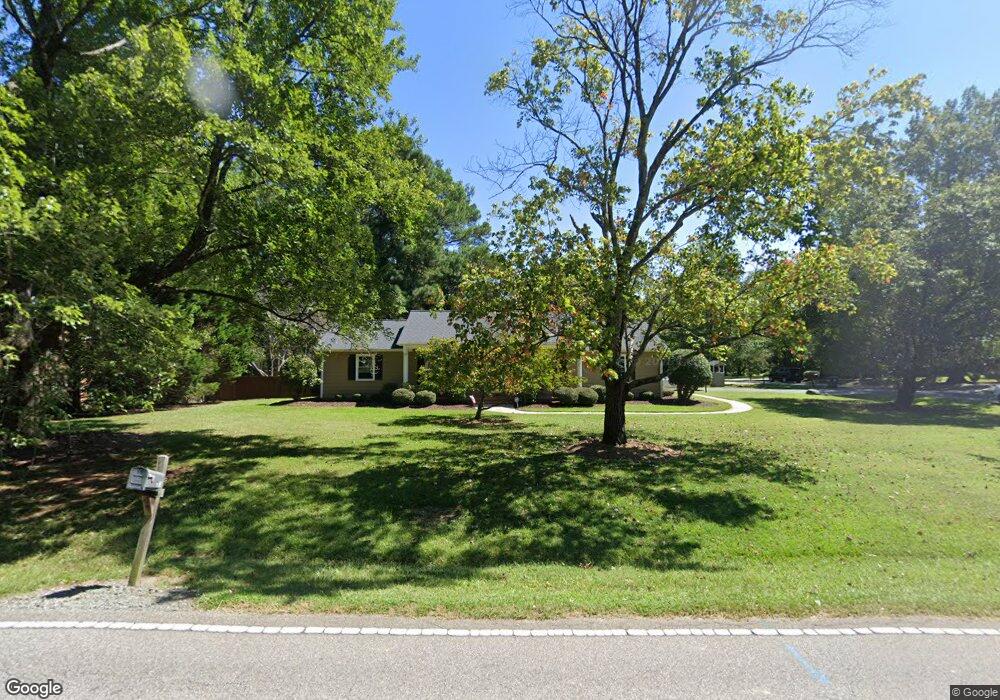
3615 Randolph Rd Durham, NC 27705
Garrett NeighborhoodEstimated Value: $392,943 - $508,000
3
Beds
2
Baths
1,660
Sq Ft
$268/Sq Ft
Est. Value
About This Home
This home is located at 3615 Randolph Rd, Durham, NC 27705 and is currently estimated at $444,736, approximately $267 per square foot. 3615 Randolph Rd is a home located in Durham County with nearby schools including Morehead Montessori, Forest View Elementary, and Sherwood Githens Middle.
Ownership History
Date
Name
Owned For
Owner Type
Purchase Details
Closed on
Aug 16, 2002
Sold by
Barnes David R
Bought by
Barnes Debra G
Current Estimated Value
Create a Home Valuation Report for This Property
The Home Valuation Report is an in-depth analysis detailing your home's value as well as a comparison with similar homes in the area
Home Values in the Area
Average Home Value in this Area
Purchase History
| Date | Buyer | Sale Price | Title Company |
|---|---|---|---|
| Barnes Debra G | -- | -- |
Source: Public Records
Tax History
| Year | Tax Paid | Tax Assessment Tax Assessment Total Assessment is a certain percentage of the fair market value that is determined by local assessors to be the total taxable value of land and additions on the property. | Land | Improvement |
|---|---|---|---|---|
| 2025 | $2,353 | $335,698 | $148,352 | $187,346 |
| 2024 | $2,256 | $229,458 | $44,280 | $185,178 |
| 2023 | $2,133 | $229,458 | $44,280 | $185,178 |
| 2022 | $2,044 | $229,458 | $44,280 | $185,178 |
| 2021 | $1,831 | $229,458 | $44,280 | $185,178 |
| 2020 | $1,808 | $229,458 | $44,280 | $185,178 |
| 2019 | $1,808 | $244,218 | $59,040 | $185,178 |
| 2018 | $1,713 | $197,953 | $59,040 | $138,913 |
| 2017 | $1,693 | $197,953 | $59,040 | $138,913 |
| 2016 | $1,639 | $197,953 | $59,040 | $138,913 |
| 2015 | $1,357 | $136,445 | $33,693 | $102,752 |
| 2014 | $1,357 | $136,445 | $33,693 | $102,752 |
Source: Public Records
Map
Nearby Homes
- 3704 Keohane Dr
- 308 Few Cir
- 3806 Lochnora Pkwy
- 3435 Cromwell Rd
- 4514 Erwin Rd
- 100 Pathwood Ln
- 3305 Coachmans Way
- 3207 W Cornwallis Rd
- 3205 W Cornwallis Rd
- 103 Spring Blossom Ln
- 3088 Colony Rd Unit A
- 3080 Colony Rd Unit 3080a
- 58 Stoneridge Rd
- 16 Marchmont Ct
- 0 Dry Creek Rd
- 18 Marchmont Ct
- 1227 Birchbark Rd
- 3 Creekview Ln
- 116 Carramore Ln
- 2201 W Cornwallis Rd Unit 2b-2
- 3611 Randolph Rd
- 3625 Randolph Rd
- 3618 Randolph Rd
- 3612 Alman Dr
- 3622 Randolph Rd
- 3608 Alman Dr
- 3615 Alman Dr
- 3617 Alman Dr
- 3820 Pickett Rd
- 3612 Randolph Rd
- 3626 Randolph Rd
- 3610 Randolph Rd
- 3818 Pickett Rd
- 3707 Keohane Dr
- 3705 Keohane Dr
- 3630 Randolph Rd
- 3703 Keohane Dr
- 3816 Pickett Rd
- 3602 Randolph Rd
- 3613 Alman Dr
Your Personal Tour Guide
Ask me questions while you tour the home.