E
Seller's Agent in 2015
Elmyria Chivers
Meybohm
Estimated Value: $199,744 - $212,000
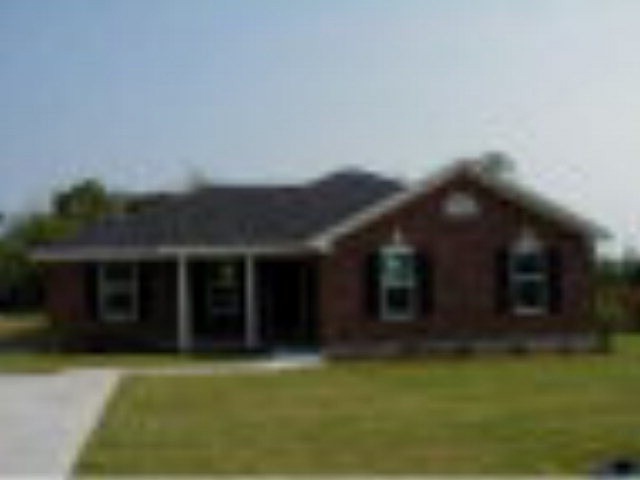
All brick ranch with 4 bedrooms and 2 full baths. Ready for a new family. Seller is a licensed Realtor in the State of Georgia.
Last Agent to Sell the Property
Elmyria Chivers
Meybohm Real Estate -hephzibah Listed on: 07/29/2015
| Date | Buyer | Sale Price | Title Company |
|---|---|---|---|
| Ross Annyannah | $92,900 | -- | |
| Hollis Clarence O | -- | -- | |
| Federal Natl Mtg Assn Fnma | -- | -- | |
| Everhome Mtg Co | $88,750 | -- | |
| Overton Willie J | $93,900 | -- |
| Date | Status | Borrower | Loan Amount |
|---|---|---|---|
| Open | Ross Annyannah | $94,021 | |
| Closed | Ross Annyannah | $94,021 | |
| Previous Owner | Overton Willie J | $93,900 |
| Date | Event | Price | List to Sale | Price per Sq Ft |
|---|---|---|---|---|
| 11/12/2015 11/12/15 | Sold | $92,900 | 0.0% | $66 / Sq Ft |
| 08/12/2015 08/12/15 | Pending | -- | -- | -- |
| 07/29/2015 07/29/15 | For Sale | $92,900 | -- | $66 / Sq Ft |
| Year | Tax Paid | Tax Assessment Tax Assessment Total Assessment is a certain percentage of the fair market value that is determined by local assessors to be the total taxable value of land and additions on the property. | Land | Improvement |
|---|---|---|---|---|
| 2025 | $2,279 | $72,344 | $7,380 | $64,964 |
| 2024 | $2,279 | $76,568 | $7,380 | $69,188 |
| 2023 | $1,531 | $67,780 | $7,380 | $60,400 |
| 2022 | $1,970 | $61,205 | $7,380 | $53,825 |
| 2021 | $1,424 | $38,450 | $7,380 | $31,070 |
| 2020 | $1,404 | $38,450 | $7,380 | $31,070 |
| 2019 | $1,478 | $38,450 | $7,380 | $31,070 |
| 2018 | $1,487 | $38,450 | $7,380 | $31,070 |
| 2016 | $1,382 | $38,450 | $7,380 | $31,070 |
| 2015 | $1,596 | $38,450 | $7,380 | $31,070 |
| 2014 | $1,598 | $38,450 | $7,380 | $31,070 |
E
Seller's Agent in 2015
Elmyria Chivers
Meybohm

Buyer's Agent in 2015
Jasmin Bradley
Keller Williams Realty Augusta
(706) 352-9010
7 in this area
347 Total Sales
Source: REALTORS® of Greater Augusta
MLS Number: 389719
APN: 1433080000
Disclaimer: Certain information contained herein is derived from information provided by parties other than Homes.com. All information provided is deemed reliable, but is not guaranteed to be accurate and should be independently verified.
![]() IDX information is provided exclusively for personal, non-commercial use, and may not be used for any purpose other than to identify prospective properties consumers may be interested in purchasing.
IDX information is provided exclusively for personal, non-commercial use, and may not be used for any purpose other than to identify prospective properties consumers may be interested in purchasing.
Information is deemed reliable but not guaranteed.