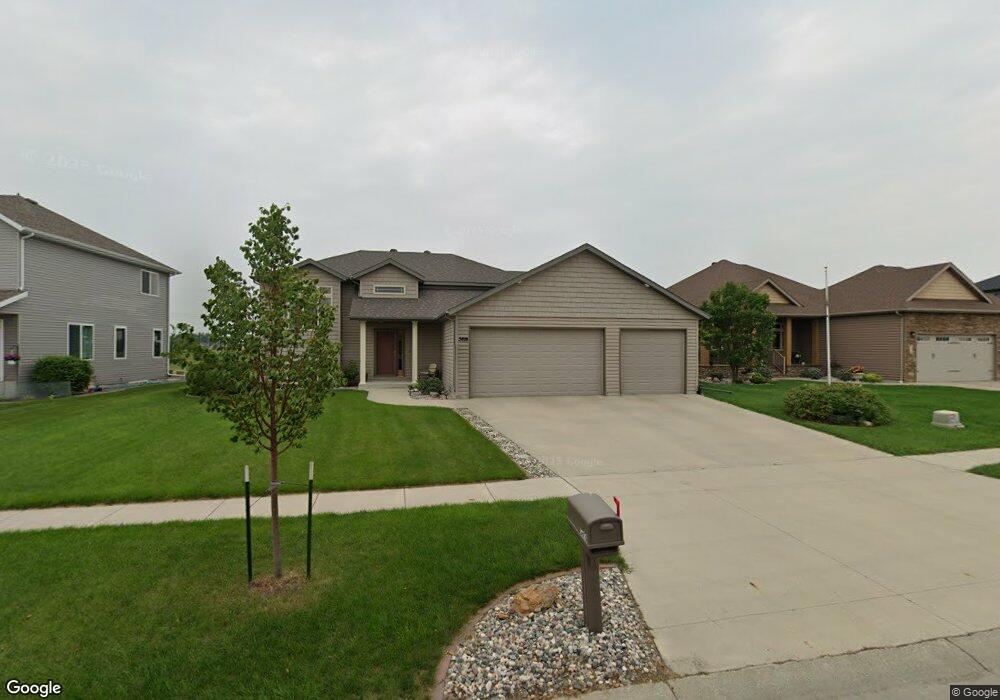
3616 12th St W West Fargo, ND 58078
Eagle Run NeighborhoodEstimated Value: $389,000 - $440,880
4
Beds
3
Baths
2,226
Sq Ft
$186/Sq Ft
Est. Value
About This Home
This home is located at 3616 12th St W, West Fargo, ND 58078 and is currently estimated at $414,940, approximately $186 per square foot. 3616 12th St W is a home located in Cass County with nearby schools including Aurora Elementary School, Liberty Middle School, and West Fargo Sheyenne High School.
Ownership History
Date
Name
Owned For
Owner Type
Purchase Details
Closed on
Jun 22, 2018
Sold by
Bettmann Holly M and Bettmann Gary W
Bought by
Hopper Guy D and Hopper Doreen M
Current Estimated Value
Home Financials for this Owner
Home Financials are based on the most recent Mortgage that was taken out on this home.
Original Mortgage
$140,000
Outstanding Balance
$84,209
Interest Rate
4.6%
Mortgage Type
New Conventional
Estimated Equity
$330,731
Purchase Details
Closed on
Apr 15, 2011
Sold by
Rhr Construction Inc
Bought by
Bettmann Holly M and Bettmann Gary W
Home Financials for this Owner
Home Financials are based on the most recent Mortgage that was taken out on this home.
Original Mortgage
$189,375
Interest Rate
4.62%
Mortgage Type
FHA
Purchase Details
Closed on
May 12, 2010
Sold by
Eagle Run 13Th Llc
Bought by
Rhr Construction Inc
Home Financials for this Owner
Home Financials are based on the most recent Mortgage that was taken out on this home.
Original Mortgage
$162,745
Interest Rate
5.05%
Mortgage Type
Construction
Create a Home Valuation Report for This Property
The Home Valuation Report is an in-depth analysis detailing your home's value as well as a comparison with similar homes in the area
Home Values in the Area
Average Home Value in this Area
Purchase History
| Date | Buyer | Sale Price | Title Company |
|---|---|---|---|
| Hopper Guy D | $290,000 | Regnecy Title | |
| Bettmann Holly M | -- | -- | |
| Rhr Construction Inc | -- | -- |
Source: Public Records
Mortgage History
| Date | Status | Borrower | Loan Amount |
|---|---|---|---|
| Open | Hopper Guy D | $140,000 | |
| Previous Owner | Bettmann Holly M | $189,375 | |
| Previous Owner | Rhr Construction Inc | $162,745 |
Source: Public Records
Tax History Compared to Growth
Tax History
| Year | Tax Paid | Tax Assessment Tax Assessment Total Assessment is a certain percentage of the fair market value that is determined by local assessors to be the total taxable value of land and additions on the property. | Land | Improvement |
|---|---|---|---|---|
| 2024 | $4,452 | $174,750 | $27,350 | $147,400 |
| 2023 | $4,874 | $171,650 | $27,350 | $144,300 |
| 2022 | $4,554 | $157,600 | $27,350 | $130,250 |
| 2021 | $4,289 | $146,900 | $21,900 | $125,000 |
| 2020 | $4,050 | $141,200 | $21,900 | $119,300 |
| 2019 | $3,960 | $136,700 | $21,900 | $114,800 |
| 2018 | $3,549 | $126,150 | $21,900 | $104,250 |
| 2017 | $3,587 | $127,200 | $21,900 | $105,300 |
| 2016 | $3,009 | $120,150 | $21,900 | $98,250 |
| 2015 | $2,886 | $108,200 | $14,950 | $93,250 |
| 2014 | $2,785 | $101,100 | $14,950 | $86,150 |
| 2013 | $670 | $22,000 | $14,950 | $7,050 |
Source: Public Records
Map
Nearby Homes
- 1040 39th Ave W
- 3662 N Sedona Ct
- 909 38 1 2 Ave W
- 1156 42nd Ave W Unit A
- 1054 42nd Ave W
- 1236 S Beach Way
- 1168 43rd Ave W
- 1381 Westport Beach Way
- 945 31st Ave W
- 922 31st Ave W
- 1015 29th Ave W
- 939 Eaglewood Ave
- 4509 11th St W
- 4507 Newport Ln
- 360 32nd Ave W Unit 608
- 360 32nd Ave W Unit 508
- 4534 Westport Pkwy
- 2734 12th St W
- 2735 11th St W
- 2737 10th St W
- 3610 12th St W
- 3622 12th St W
- 3628 12th St W
- 3604 12th St W
- 3617 12th St W
- 3611 12th St W
- 3712 12th St W
- 3623 12th St W
- 3605 12th St W
- 3629 12th St W
- 3718 12th St W
- 3707 12th St W
- 1131 36th Ave W
- 3713 12th St W
- 3724 12th St W
- 3719 12th St W
- 1125 36th Ave W
- 3725 12th St W
- 1136 36th Ave W
- 1119 36th Ave W