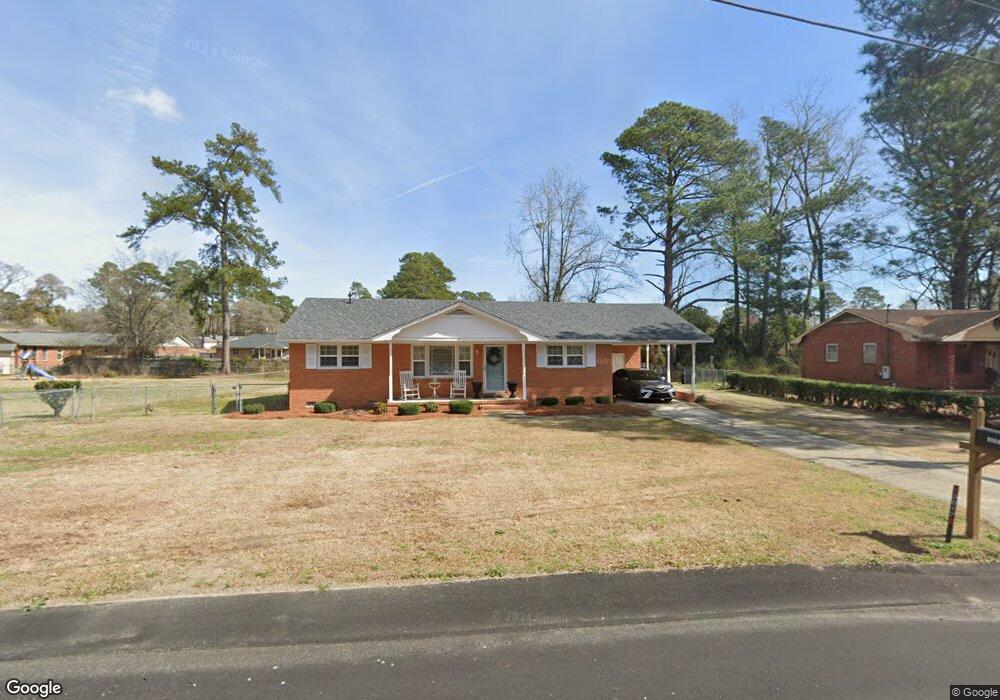
3617 Carroll Dr Florence, SC 29506
Glendale Acres NeighborhoodEstimated Value: $158,000 - $168,000
3
Beds
2
Baths
1,272
Sq Ft
$128/Sq Ft
Est. Value
About This Home
This home is located at 3617 Carroll Dr, Florence, SC 29506 and is currently estimated at $162,339, approximately $127 per square foot. 3617 Carroll Dr is a home located in Florence County with nearby schools including Wallace Gregg Elementary School, Williams Middle School, and Wilson High School.
Ownership History
Date
Name
Owned For
Owner Type
Purchase Details
Closed on
Oct 1, 2015
Sold by
Easterling James Franklin
Bought by
Robinson Duncan
Current Estimated Value
Home Financials for this Owner
Home Financials are based on the most recent Mortgage that was taken out on this home.
Original Mortgage
$93,769
Outstanding Balance
$74,372
Interest Rate
4.12%
Mortgage Type
FHA
Estimated Equity
$87,967
Purchase Details
Closed on
Aug 14, 2014
Sold by
Altman Carl
Bought by
Easterling James Franklin
Purchase Details
Closed on
Jul 25, 2014
Sold by
Fannie Mae
Bought by
Altman Carl
Purchase Details
Closed on
Jan 13, 2014
Sold by
Grant Betty S and Grant Paul E
Bought by
Federal National Mortgage Association
Purchase Details
Closed on
Mar 12, 2009
Sold by
Grant Betty S and Grant Betty Deas
Bought by
Grant Betty S and Grant Paul E
Home Financials for this Owner
Home Financials are based on the most recent Mortgage that was taken out on this home.
Original Mortgage
$132,000
Interest Rate
3.43%
Mortgage Type
Reverse Mortgage Home Equity Conversion Mortgage
Create a Home Valuation Report for This Property
The Home Valuation Report is an in-depth analysis detailing your home's value as well as a comparison with similar homes in the area
Home Values in the Area
Average Home Value in this Area
Purchase History
| Date | Buyer | Sale Price | Title Company |
|---|---|---|---|
| Robinson Duncan | $95,500 | -- | |
| Easterling James Franklin | $14,500 | -- | |
| Altman Carl | $14,500 | -- | |
| Federal National Mortgage Association | $2,500 | -- | |
| Grant Betty S | -- | -- |
Source: Public Records
Mortgage History
| Date | Status | Borrower | Loan Amount |
|---|---|---|---|
| Open | Robinson Duncan | $93,769 | |
| Previous Owner | Grant Betty S | $132,000 |
Source: Public Records
Tax History Compared to Growth
Tax History
| Year | Tax Paid | Tax Assessment Tax Assessment Total Assessment is a certain percentage of the fair market value that is determined by local assessors to be the total taxable value of land and additions on the property. | Land | Improvement |
|---|---|---|---|---|
| 2024 | $456 | $5,326 | $436 | $4,890 |
| 2023 | $398 | $3,798 | $436 | $3,362 |
| 2022 | $563 | $3,798 | $436 | $3,362 |
| 2021 | $492 | $3,800 | $0 | $0 |
| 2020 | $517 | $3,800 | $0 | $0 |
| 2019 | $518 | $3,798 | $436 | $3,362 |
| 2018 | $465 | $3,800 | $0 | $0 |
| 2017 | $496 | $3,800 | $0 | $0 |
| 2016 | $403 | $3,800 | $0 | $0 |
| 2015 | $1,138 | $3,600 | $0 | $0 |
| 2014 | $299 | $3,036 | $436 | $2,600 |
Source: Public Records
Map
Nearby Homes
- 412 Newport Dr
- 410 N Salem Dr
- 3094 Cobblestone St
- 201 N Williamson Rd
- 300 N Williamson Rd
- 3090 Cobblestone St
- 2797 Leola Hill Dr
- 200 Hudson Dr
- 3712 E Hoyt St
- 231 Yolanda Dr
- 225 Yolanda Dr
- 238 Yolanda Dr
- 229 Yolanda Dr
- 230 Yolanda Dr
- 237 Yolanda Dr
- 227 Yolanda Dr
- 234 Yolanda Dr
- 228 Yolanda Dr
- TBD E Palmetto Street & Quartz Ln
- 429 S Wallace Rd
- 3619 Carroll Dr
- 3615 Carroll Dr
- 3704 E Winlark Dr
- 3706 E Winlark Dr
- 3702 E Winlark Dr
- 3614 Carroll Dr
- 3612 Carroll Dr
- 3701 E King Henry Dr
- 3703 E King Henry Dr
- 3613 Carroll Dr
- 3700 E Winlark Dr
- 3705 E King Henry Dr
- 3610 Carroll Dr
- 3614 E Winlark Dr
- 3619 E King Henry Dr
- 3619 E King Henry Dr
- 3705 E Winlark Dr
- 3703 E Winlark Dr
- 3707 E Winlark Dr
- 3612 E Winlark Dr