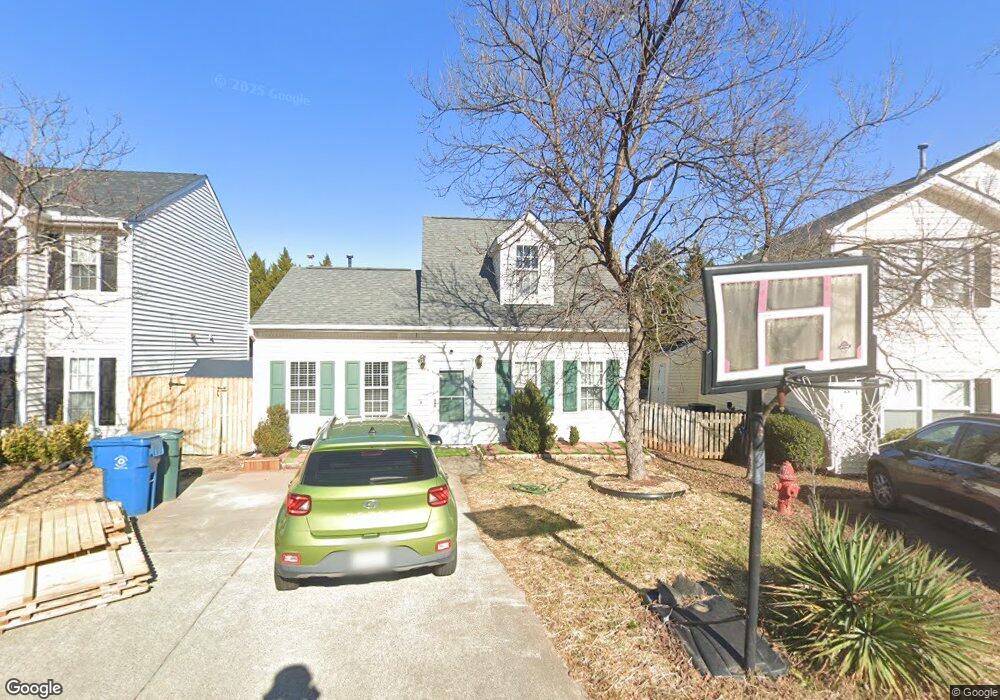
3617 Sana Ct Durham, NC 27713
Woodcroft NeighborhoodEstimated Value: $307,000 - $359,000
3
Beds
2
Baths
1,166
Sq Ft
$279/Sq Ft
Est. Value
About This Home
This home is located at 3617 Sana Ct, Durham, NC 27713 and is currently estimated at $325,035, approximately $278 per square foot. 3617 Sana Ct is a home located in Durham County with nearby schools including Pearsontown Elementary School, Lowe's Grove Middle, and Hillside High School.
Ownership History
Date
Name
Owned For
Owner Type
Purchase Details
Closed on
Jul 9, 2018
Sold by
Eubanks Jameka and Parrish Kendrick
Bought by
Roumani Lamia
Current Estimated Value
Home Financials for this Owner
Home Financials are based on the most recent Mortgage that was taken out on this home.
Original Mortgage
$164,900
Outstanding Balance
$143,226
Interest Rate
4.6%
Mortgage Type
New Conventional
Estimated Equity
$181,809
Purchase Details
Closed on
Feb 27, 2003
Sold by
Watts Oscar Page and Watts Sandra Denise
Bought by
Eubanks Jameka
Home Financials for this Owner
Home Financials are based on the most recent Mortgage that was taken out on this home.
Original Mortgage
$114,650
Interest Rate
5.82%
Purchase Details
Closed on
Nov 4, 1998
Sold by
Anderson Homes Inc
Bought by
Watts Oscar Page
Home Financials for this Owner
Home Financials are based on the most recent Mortgage that was taken out on this home.
Original Mortgage
$101,555
Interest Rate
6.25%
Create a Home Valuation Report for This Property
The Home Valuation Report is an in-depth analysis detailing your home's value as well as a comparison with similar homes in the area
Home Values in the Area
Average Home Value in this Area
Purchase History
| Date | Buyer | Sale Price | Title Company |
|---|---|---|---|
| Roumani Lamia | $170,000 | None Available | |
| Eubanks Jameka | $113,500 | -- | |
| Watts Oscar Page | $107,000 | -- |
Source: Public Records
Mortgage History
| Date | Status | Borrower | Loan Amount |
|---|---|---|---|
| Open | Roumani Lamia | $164,900 | |
| Previous Owner | Eubanks Jameka | $114,650 | |
| Previous Owner | Watts Oscar Page | $101,555 |
Source: Public Records
Tax History Compared to Growth
Tax History
| Year | Tax Paid | Tax Assessment Tax Assessment Total Assessment is a certain percentage of the fair market value that is determined by local assessors to be the total taxable value of land and additions on the property. | Land | Improvement |
|---|---|---|---|---|
| 2025 | $2,959 | $298,531 | $112,350 | $186,181 |
| 2024 | $2,393 | $171,527 | $32,010 | $139,517 |
| 2023 | $2,247 | $171,527 | $32,010 | $139,517 |
| 2022 | $2,195 | $171,527 | $32,010 | $139,517 |
| 2021 | $2,185 | $171,527 | $32,010 | $139,517 |
| 2020 | $2,134 | $171,527 | $32,010 | $139,517 |
| 2019 | $2,134 | $171,527 | $32,010 | $139,517 |
| 2018 | $1,598 | $117,801 | $26,675 | $91,126 |
| 2017 | $1,586 | $117,801 | $26,675 | $91,126 |
| 2016 | $1,533 | $117,801 | $26,675 | $91,126 |
| 2015 | $1,381 | $99,746 | $23,814 | $75,932 |
| 2014 | $1,381 | $99,746 | $23,814 | $75,932 |
Source: Public Records
Map
Nearby Homes
- 3702 Phillips Way W
- 1211 Odyssey Dr
- 3717 Phillips Way W
- 3617 Sugar Tree Place
- 3534 Rawdon Dr
- 3431 Balfour E
- 6 Lakemist Cir
- 3337 Tarleton W
- 3311 Tarleton W
- 3352 Tarleton W
- 110 Silver Fir Ln
- 5310 Reams Run Rd
- 9 Drakesway Ct
- 3119 N Carolina 55
- 5205 Kemmont Dr
- 3514 S Alston Ave
- 1006 Regalia Rd Unit 4
- 19 Meadhall Ct
- 4805 Barbee Rd
- 515 Uzzle St