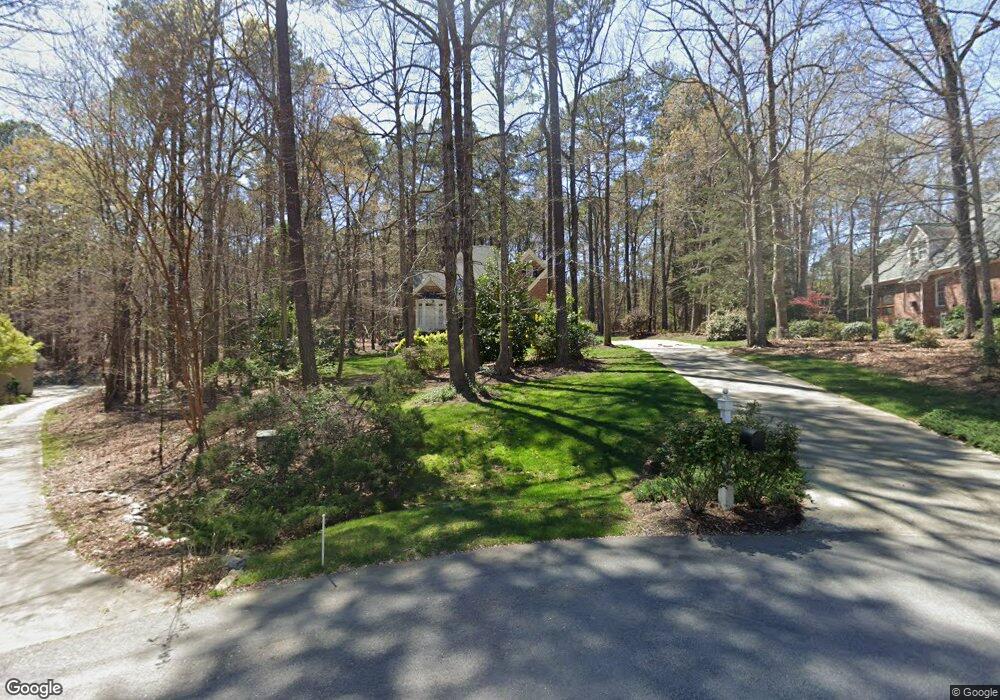
3618 Choplinshire Way Apex, NC 27539
Middle Creek NeighborhoodEstimated Value: $702,859 - $786,000
3
Beds
3
Baths
2,750
Sq Ft
$273/Sq Ft
Est. Value
About This Home
This home is located at 3618 Choplinshire Way, Apex, NC 27539 and is currently estimated at $751,715, approximately $273 per square foot. 3618 Choplinshire Way is a home located in Wake County with nearby schools including Yates Mill Elementary School, Dillard Drive Magnet Middle School, and Middle Creek High.
Ownership History
Date
Name
Owned For
Owner Type
Purchase Details
Closed on
Aug 8, 2003
Sold by
Reloaction
Bought by
Mcgregor David R and Mcgregor Ruth S
Current Estimated Value
Home Financials for this Owner
Home Financials are based on the most recent Mortgage that was taken out on this home.
Original Mortgage
$205,000
Interest Rate
4.89%
Mortgage Type
Purchase Money Mortgage
Purchase Details
Closed on
Aug 2, 2003
Sold by
Davies Steven Charles and Davies Teslime Batan
Bought by
Reloaction
Home Financials for this Owner
Home Financials are based on the most recent Mortgage that was taken out on this home.
Original Mortgage
$205,000
Interest Rate
4.89%
Mortgage Type
Purchase Money Mortgage
Purchase Details
Closed on
Dec 22, 1999
Sold by
Blls Corporation
Bought by
Davis Steven Charles
Create a Home Valuation Report for This Property
The Home Valuation Report is an in-depth analysis detailing your home's value as well as a comparison with similar homes in the area
Home Values in the Area
Average Home Value in this Area
Purchase History
| Date | Buyer | Sale Price | Title Company |
|---|---|---|---|
| Mcgregor David R | $312,000 | -- | |
| Reloaction | $312,000 | -- | |
| Davis Steven Charles | $297,000 | -- |
Source: Public Records
Mortgage History
| Date | Status | Borrower | Loan Amount |
|---|---|---|---|
| Closed | Mcgregor David R | $205,000 |
Source: Public Records
Tax History Compared to Growth
Tax History
| Year | Tax Paid | Tax Assessment Tax Assessment Total Assessment is a certain percentage of the fair market value that is determined by local assessors to be the total taxable value of land and additions on the property. | Land | Improvement |
|---|---|---|---|---|
| 2025 | $4,503 | $700,935 | $190,000 | $510,935 |
| 2024 | $4,373 | $700,935 | $190,000 | $510,935 |
| 2023 | $3,056 | $389,422 | $80,000 | $309,422 |
| 2022 | $2,832 | $389,422 | $80,000 | $309,422 |
| 2021 | $2,756 | $389,422 | $80,000 | $309,422 |
| 2020 | $2,711 | $389,422 | $80,000 | $309,422 |
| 2019 | $2,906 | $353,402 | $86,000 | $267,402 |
| 2018 | $2,672 | $353,402 | $86,000 | $267,402 |
| 2017 | $2,533 | $353,402 | $86,000 | $267,402 |
| 2016 | $2,430 | $345,981 | $86,000 | $259,981 |
| 2015 | $2,421 | $345,663 | $86,000 | $259,663 |
| 2014 | -- | $345,663 | $86,000 | $259,663 |
Source: Public Records
Map
Nearby Homes
- 6512 Ten Rd
- 6512 Ten-Ten Rd
- 3505 Knightshire Dr
- 3710 Johnson Pond Rd
- 8004 Deer Meadow Dr
- 8008 Deer Meadow Dr
- 4104 Cross Timber Ln
- 3901 Bluffwind Dr
- 8201 Rhodes Rd
- 5228 Trilogy Farm Dr
- 5300 Trilogy Farm Dr
- 5112 Lizard Tail Ln
- 7513 Orchard Crest Ct
- 8844 Forester Ln
- 3732 Westbury Lake Dr
- 4301 New Brighton Dr
- 3740 Westbury Lake Dr
- 5702 Volos Ave
- 4317 Glen Arbor Dr
- 8405 Bells Lake Rd
- 3614 Choplinshire Way
- 3622 Choplinshire Way
- 3805 Kingfield Dr
- 3617 Choplinshire Way
- 3610 Choplinshire Way
- 3613 Choplinshire Way
- 3609 Choplinshire Way
- 3620 Glenrothes Cove
- 3604 Choplinshire Way
- 3616 Glenrothes Cove
- 3801 Kingfield Dr
- 3605 Choplinshire Way
- 3612 Glenrothes Cove
- 3624 Glenrothes Cove
- 3608 Glenrothes Cove
- 6421 Ten Ten Rd
- 2509 Maxton Crest Dr
- 2517 Maxton Crest Dr
- 2401 Gillingham Dr
- 3808 Kingfield Dr