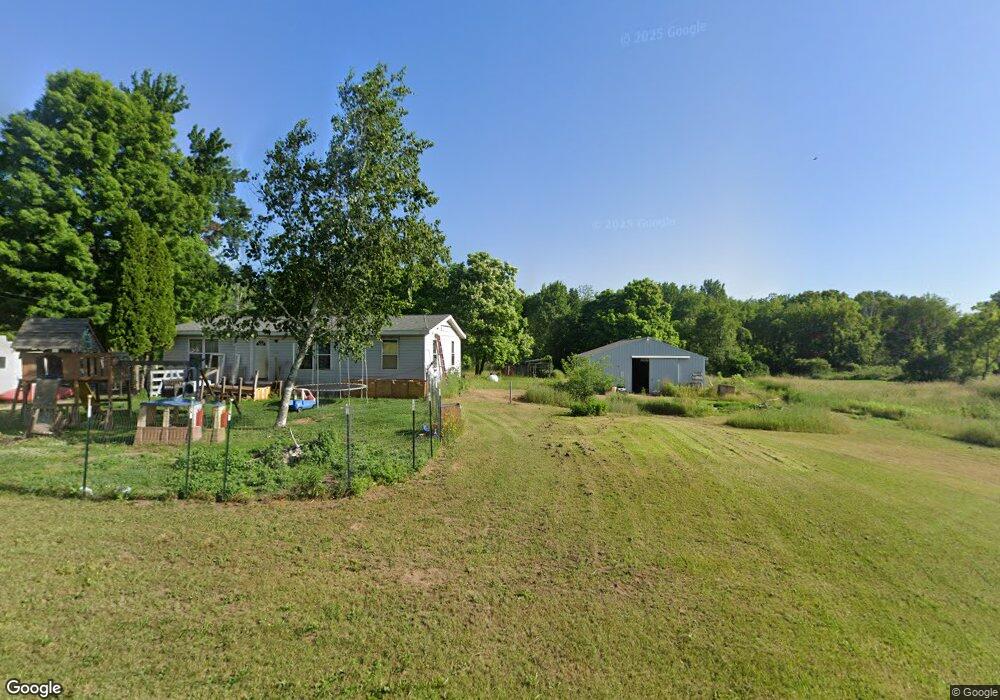
3619 109th Ave Allegan, MI 49010
Estimated Value: $95,000 - $250,000
2
Beds
2
Baths
1,340
Sq Ft
$135/Sq Ft
Est. Value
About This Home
This home is located at 3619 109th Ave, Allegan, MI 49010 and is currently estimated at $180,934, approximately $135 per square foot. 3619 109th Ave is a home located in Allegan County with nearby schools including Pine Trails Elementary School, L.E. White Middle School, and Allegan High School.
Ownership History
Date
Name
Owned For
Owner Type
Purchase Details
Closed on
Oct 13, 2011
Sold by
Stevens Oudalai
Bought by
Stevens David C
Current Estimated Value
Home Financials for this Owner
Home Financials are based on the most recent Mortgage that was taken out on this home.
Original Mortgage
$30,000
Outstanding Balance
$20,382
Interest Rate
4.02%
Mortgage Type
Seller Take Back
Estimated Equity
$160,552
Purchase Details
Closed on
Feb 28, 2011
Sold by
Rose Dana and Rose Katherine
Bought by
Rose Erik
Purchase Details
Closed on
Dec 3, 2007
Sold by
Cit Group/Consumer Finance Inc
Bought by
Rose Dana
Purchase Details
Closed on
Apr 21, 2005
Sold by
Morgan Ernie and Morgan Kathy
Bought by
The Cit Group Consumer Finance Inc
Purchase Details
Closed on
Dec 30, 1997
Bought by
Morgan Ernie and Morgan Kathy
Purchase Details
Closed on
Dec 18, 1997
Sold by
Morgan Ernie and Morgan Kathy
Bought by
Contimortgage Corp
Create a Home Valuation Report for This Property
The Home Valuation Report is an in-depth analysis detailing your home's value as well as a comparison with similar homes in the area
Home Values in the Area
Average Home Value in this Area
Purchase History
| Date | Buyer | Sale Price | Title Company |
|---|---|---|---|
| Stevens David C | -- | None Available | |
| Rose Erik | -- | None Available | |
| Rose Dana | $28,000 | Meridian Title Corp | |
| The Cit Group Consumer Finance Inc | $80,347 | -- | |
| Morgan Ernie | -- | -- | |
| Contimortgage Corp | -- | -- |
Source: Public Records
Mortgage History
| Date | Status | Borrower | Loan Amount |
|---|---|---|---|
| Open | Stevens David C | $30,000 |
Source: Public Records
Tax History Compared to Growth
Tax History
| Year | Tax Paid | Tax Assessment Tax Assessment Total Assessment is a certain percentage of the fair market value that is determined by local assessors to be the total taxable value of land and additions on the property. | Land | Improvement |
|---|---|---|---|---|
| 2025 | $1,289 | $55,100 | $17,500 | $37,600 |
| 2024 | -- | $47,000 | $15,500 | $31,500 |
| 2023 | $510 | $40,000 | $13,100 | $26,900 |
| 2022 | $510 | $36,300 | $11,600 | $24,700 |
| 2021 | $510 | $35,600 | $10,800 | $24,800 |
| 2020 | $510 | $34,100 | $10,000 | $24,100 |
| 2019 | $0 | $30,200 | $8,000 | $22,200 |
| 2018 | $0 | $29,400 | $8,000 | $21,400 |
| 2017 | $0 | $25,300 | $5,800 | $19,500 |
| 2016 | $0 | $18,800 | $5,000 | $13,800 |
| 2015 | -- | $18,800 | $5,000 | $13,800 |
| 2014 | -- | $20,900 | $6,500 | $14,400 |
| 2013 | -- | $19,800 | $6,000 | $13,800 |
Source: Public Records
Map
Nearby Homes
- 3570 109th Ave
- VL 108th Ave
- 3712 Schermerhorn Lake Dr
- 910 Apple Ridge Ct
- 923 Armintrout Ridge Ct
- 919 Armintrout Ridge Ct
- 45 acres 108th Ave
- V/L 109th Ave
- 1084 38th St
- VL 61acres 34th
- 1143 38th St
- 704 38th St
- VL 34th
- 3537 Lake Ridge Ln
- 304 39th St
- V/L Springhill Dr
- 3913 112th Ave
- Lot 18 Conley Dr
- 1269 Highland Ct
- 1077 Sun Valley Ln