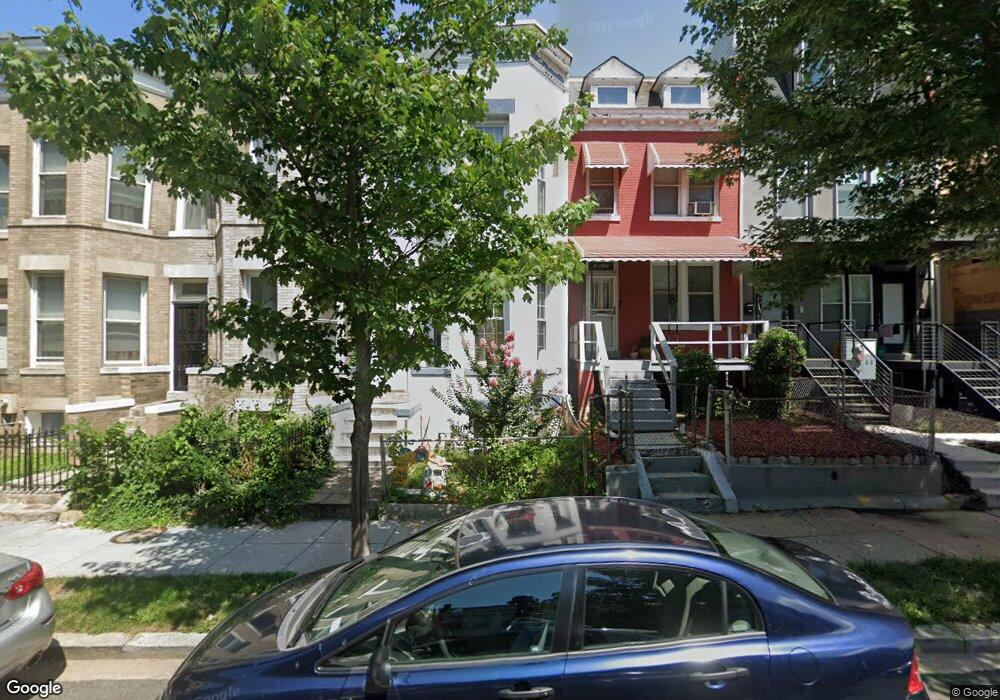
3619 10th St NW Washington, DC 20010
Columbia Heights NeighborhoodEstimated Value: $684,792 - $787,000
4
Beds
2
Baths
1,442
Sq Ft
$503/Sq Ft
Est. Value
About This Home
This home is located at 3619 10th St NW, Washington, DC 20010 and is currently estimated at $724,931, approximately $502 per square foot. 3619 10th St NW is a home located in District of Columbia with nearby schools including Raymond Education Campus, MacFarland Middle School, and Roosevelt High School @ MacFarland.
Ownership History
Date
Name
Owned For
Owner Type
Purchase Details
Closed on
Aug 2, 2005
Sold by
Benitez Jose Villatoro
Bought by
Amaya Romeo C and Camaya,Etelia Del C
Current Estimated Value
Home Financials for this Owner
Home Financials are based on the most recent Mortgage that was taken out on this home.
Original Mortgage
$294,400
Outstanding Balance
$155,463
Interest Rate
5.84%
Mortgage Type
New Conventional
Estimated Equity
$569,468
Purchase Details
Closed on
May 3, 1995
Sold by
Hernandez Raul
Bought by
Amaya Mireya
Home Financials for this Owner
Home Financials are based on the most recent Mortgage that was taken out on this home.
Original Mortgage
$116,053
Interest Rate
8.36%
Purchase Details
Closed on
Mar 6, 1995
Sold by
Coleman Margaret H
Bought by
Hernandez Raul
Home Financials for this Owner
Home Financials are based on the most recent Mortgage that was taken out on this home.
Original Mortgage
$116,053
Interest Rate
8.36%
Create a Home Valuation Report for This Property
The Home Valuation Report is an in-depth analysis detailing your home's value as well as a comparison with similar homes in the area
Home Values in the Area
Average Home Value in this Area
Purchase History
| Date | Buyer | Sale Price | Title Company |
|---|---|---|---|
| Amaya Romeo C | $368,000 | -- | |
| Amaya Mireya | $116,200 | -- | |
| Hernandez Raul | $75,000 | -- |
Source: Public Records
Mortgage History
| Date | Status | Borrower | Loan Amount |
|---|---|---|---|
| Open | Amaya Romeo C | $294,400 | |
| Previous Owner | Amaya Mireya | $116,053 | |
| Previous Owner | Hernandez Raul | $60,000 |
Source: Public Records
Tax History
| Year | Tax Paid | Tax Assessment Tax Assessment Total Assessment is a certain percentage of the fair market value that is determined by local assessors to be the total taxable value of land and additions on the property. | Land | Improvement |
|---|---|---|---|---|
| 2025 | $5,320 | $715,710 | $455,530 | $260,180 |
| 2024 | $5,274 | $707,570 | $450,960 | $256,610 |
| 2023 | $5,251 | $701,790 | $447,480 | $254,310 |
| 2022 | $4,895 | $654,590 | $426,260 | $228,330 |
| 2021 | $4,749 | $640,260 | $419,960 | $220,300 |
| 2020 | $4,322 | $629,420 | $420,270 | $209,150 |
| 2019 | $3,936 | $608,290 | $397,550 | $210,740 |
| 2017 | $3,270 | $552,000 | $0 | $0 |
| 2016 | $2,979 | $493,580 | $0 | $0 |
Source: Public Records
Map
Nearby Homes
- 3644 New Hampshire Ave NW
- 3656 New Hampshire Ave NW Unit 4
- 3656 New Hampshire Ave NW Unit 3
- 3534 10th St NW Unit 200
- 825 Rock Creek Church Rd NW
- 747 Newton Place NW
- 1213 Otis Place NW
- 739 Newton Place NW Unit 104
- 1011 Quebec Place NW
- 3619 Georgia Ave NW Unit 603
- 3619 Georgia Ave NW Unit 405
- 1017 Monroe St NW Unit 2
- 3709 13th St NW Unit 105
- 3524 11th St NW
- 770 Park Rd NW Unit 203
- 3620 13th St NW Unit 2
- 3620 13th St NW Unit 1
- 764 Park Rd NW
- 3646 13th St NW Unit 3
- 3572 13th St NW Unit 2
- 3621 10th St NW
- 3617 10th St NW
- 3615 10th St NW Unit PH-B
- 3615 10th St NW
- 3623 10th St NW
- 3625 10th St NW
- 3613 10th St NW
- 3627 10th St NW
- 3611 10th St NW
- 3629 10th St NW
- 3609 10th St NW
- 3631 10th St NW
- 926 Spring Rd NW
- 3607 10th St NW
- 924 Spring Rd NW
- 922 Spring Rd NW
- 3633 10th St NW
- 3605 10th St NW
- 3605 10th St NW
- 3605 10th St NW
Your Personal Tour Guide
Ask me questions while you tour the home.