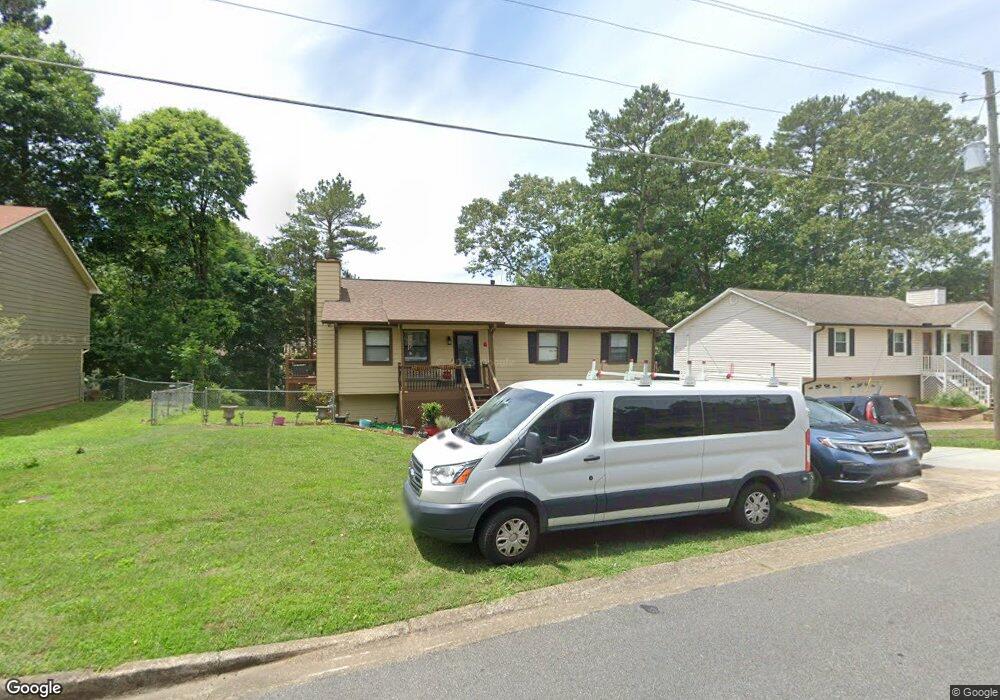
3619 Cherokee Overlook Dr Unit I Canton, GA 30115
Estimated Value: $319,000 - $341,014
3
Beds
2
Baths
1,968
Sq Ft
$168/Sq Ft
Est. Value
About This Home
This home is located at 3619 Cherokee Overlook Dr Unit I, Canton, GA 30115 and is currently estimated at $330,007, approximately $167 per square foot. 3619 Cherokee Overlook Dr Unit I is a home located in Cherokee County with nearby schools including Indian Knoll Elementary School, Rusk Middle School, and Sequoyah High School.
Ownership History
Date
Name
Owned For
Owner Type
Purchase Details
Closed on
Oct 24, 2017
Sold by
Vidal Maria Teresa
Bought by
Vidal Maria Teresa and Vidal David
Current Estimated Value
Home Financials for this Owner
Home Financials are based on the most recent Mortgage that was taken out on this home.
Original Mortgage
$85,000
Outstanding Balance
$45,731
Interest Rate
3.83%
Mortgage Type
New Conventional
Estimated Equity
$284,276
Purchase Details
Closed on
Oct 28, 1999
Sold by
Johnston Johnston F and Johnston Judith A
Bought by
Aguirre Peter J
Home Financials for this Owner
Home Financials are based on the most recent Mortgage that was taken out on this home.
Original Mortgage
$97,500
Interest Rate
11.38%
Mortgage Type
New Conventional
Purchase Details
Closed on
Jun 10, 1994
Sold by
Clark Ernest P and Clark Patricia Ann
Bought by
Johnston F Ross and Johnston Judith A
Create a Home Valuation Report for This Property
The Home Valuation Report is an in-depth analysis detailing your home's value as well as a comparison with similar homes in the area
Home Values in the Area
Average Home Value in this Area
Purchase History
| Date | Buyer | Sale Price | Title Company |
|---|---|---|---|
| Vidal Maria Teresa | -- | -- | |
| Aguirre Peter J | $97,500 | -- | |
| Johnston F Ross | $7,400 | -- |
Source: Public Records
Mortgage History
| Date | Status | Borrower | Loan Amount |
|---|---|---|---|
| Open | Vidal Maria Teresa | $85,000 | |
| Previous Owner | Aguirre Peter J | $97,500 | |
| Closed | Johnston F Ross | $0 |
Source: Public Records
Tax History Compared to Growth
Tax History
| Year | Tax Paid | Tax Assessment Tax Assessment Total Assessment is a certain percentage of the fair market value that is determined by local assessors to be the total taxable value of land and additions on the property. | Land | Improvement |
|---|---|---|---|---|
| 2025 | $2,824 | $111,808 | $26,000 | $85,808 |
| 2024 | $2,770 | $109,048 | $24,400 | $84,648 |
| 2023 | $2,475 | $116,968 | $24,400 | $92,568 |
| 2022 | $2,325 | $90,040 | $19,200 | $70,840 |
| 2021 | $2,008 | $71,628 | $14,400 | $57,228 |
| 2020 | $1,772 | $62,220 | $12,800 | $49,420 |
| 2019 | $1,704 | $59,480 | $12,800 | $46,680 |
| 2018 | $1,533 | $52,480 | $12,000 | $40,480 |
| 2017 | $1,490 | $126,000 | $12,000 | $38,400 |
| 2016 | $1,130 | $116,300 | $10,000 | $36,520 |
| 2015 | $981 | $101,000 | $8,800 | $31,600 |
| 2014 | $1,114 | $91,700 | $8,000 | $28,680 |
Source: Public Records
Map
Nearby Homes
- 3548 Cherokee Overlook Dr
- 3714 Cherokee Overlook Dr Unit 2
- 201 Hillcrest Ridge
- 832 Overlook Trail
- 254 Hillcrest Ridge Unit 2
- 809 Overlook Trail
- 3789 Cherokee Overlook Dr
- 365 Russell King Ln
- 209 Forest Trace
- 240 Rose Ridge Dr
- 253 Newt Fowler Ln
- 231 Breeze Hill Ln
- 302 and 304 Garland Way
- 0 Reed St Unit 7646438
- 2790 Hickory Flat Hwy
- 701 Longview Dr
- 0 Governors Walk Dr Unit 7294252
- 160 Scott Rd
- 1200 Tom Hulsey Dr
- 120 Jeanette St
- 3609 Cherokee Overlook Dr Unit 1
- 3635 Cherokee Overlook Dr
- 430 Lightfoot Ct
- 421 Lightfoot Ct
- 3597 Cherokee Overlook Dr
- 2300 Trenton Dr
- 3624 Cherokee Overlook Dr
- 3612 Cherokee Overlook Dr
- 3636 Cherokee Overlook Dr Unit 3
- 3636 Cherokee Overlook Dr
- 2310 Trenton Dr Unit 1
- 411 Lightfoot Ct
- 411 Lightfoot Ct
- 420 Lightfoot Ct
- 411 Lightfoot Ct Canton Ga 30115 1
- 411 Lightfoot Ct
- 3600 Cherokee Overlook Dr
- 3648 Cherokee Overlook Dr
- 3585 Cherokee Overlook Dr
- 2320 Trenton Dr