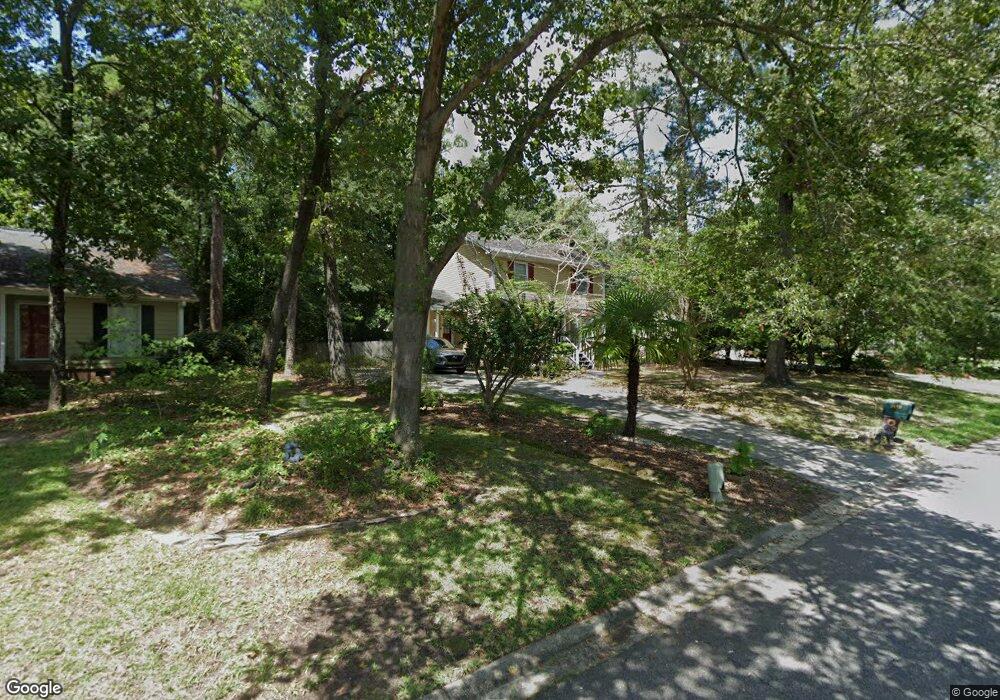
3619 Linbrook Dr Columbia, SC 29204
Estimated Value: $243,000 - $268,000
3
Beds
3
Baths
1,410
Sq Ft
$178/Sq Ft
Est. Value
About This Home
This home is located at 3619 Linbrook Dr, Columbia, SC 29204 and is currently estimated at $251,658, approximately $178 per square foot. 3619 Linbrook Dr is a home located in Richland County with nearby schools including Brockman Elementary School, Satchel Ford Elementary School, and Crayton Middle School.
Ownership History
Date
Name
Owned For
Owner Type
Purchase Details
Closed on
Jun 22, 2007
Sold by
Cleary Eleanor
Bought by
Dominion Financial Service Corp
Current Estimated Value
Purchase Details
Closed on
Apr 18, 2007
Sold by
Cleary Vivian Dominic
Bought by
Cleary Eleanor D
Purchase Details
Closed on
Dec 13, 2002
Sold by
Goolsby John B and Goolsby Marianne S
Bought by
Cleary Vivian D and Cleary Eleanor D
Home Financials for this Owner
Home Financials are based on the most recent Mortgage that was taken out on this home.
Original Mortgage
$119,225
Interest Rate
6.08%
Purchase Details
Closed on
Oct 13, 2000
Sold by
Johnson Brenda G and Johnson Brenda G
Bought by
Goolsby John B and Goolsby Marianne S
Home Financials for this Owner
Home Financials are based on the most recent Mortgage that was taken out on this home.
Original Mortgage
$108,000
Interest Rate
7.96%
Create a Home Valuation Report for This Property
The Home Valuation Report is an in-depth analysis detailing your home's value as well as a comparison with similar homes in the area
Home Values in the Area
Average Home Value in this Area
Purchase History
| Date | Buyer | Sale Price | Title Company |
|---|---|---|---|
| Dominion Financial Service Corp | $138,000 | None Available | |
| Cleary Eleanor D | -- | None Available | |
| Cleary Vivian D | $125,500 | -- | |
| Goolsby John B | $115,000 | -- |
Source: Public Records
Mortgage History
| Date | Status | Borrower | Loan Amount |
|---|---|---|---|
| Previous Owner | Cleary Vivian D | $119,225 | |
| Previous Owner | Goolsby John B | $108,000 |
Source: Public Records
Tax History Compared to Growth
Tax History
| Year | Tax Paid | Tax Assessment Tax Assessment Total Assessment is a certain percentage of the fair market value that is determined by local assessors to be the total taxable value of land and additions on the property. | Land | Improvement |
|---|---|---|---|---|
| 2024 | $4,580 | $165,700 | $0 | $0 |
| 2023 | $4,580 | $5,764 | $0 | $0 |
| 2022 | $4,164 | $144,100 | $34,000 | $110,100 |
| 2021 | $4,170 | $8,650 | $0 | $0 |
| 2020 | $4,202 | $8,650 | $0 | $0 |
| 2019 | $4,218 | $8,650 | $0 | $0 |
| 2018 | $3,894 | $7,890 | $0 | $0 |
| 2017 | $3,784 | $7,890 | $0 | $0 |
| 2016 | $3,707 | $7,890 | $0 | $0 |
| 2015 | $3,666 | $7,890 | $0 | $0 |
| 2014 | $3,542 | $131,500 | $0 | $0 |
| 2013 | -- | $7,890 | $0 | $0 |
Source: Public Records
Map
Nearby Homes
- 5 Forest Trace Way
- 3801 Baldwin Rd
- 2 Forest Trace Ct
- 4725 Circle Dr
- 6639 Satchelford Rd
- 6546 Haley Dr
- 6609 Satchelford Rd
- 4739 Circle Dr
- 6716 Satchelford Rd
- 6700 Satchelford Rd
- Satchel Ford Plan at Satchel Ford
- 1626 Albritton Rd
- 6640 Satchelford Rd
- 6648 Satchelford Rd
- 6810 Satchelford Rd
- 3306 Pine Belt Rd
- 4725 Crystal Dr
- 3541 Foxhall Rd
- 2 Godbold Ct
- 3544 Foxhall Rd