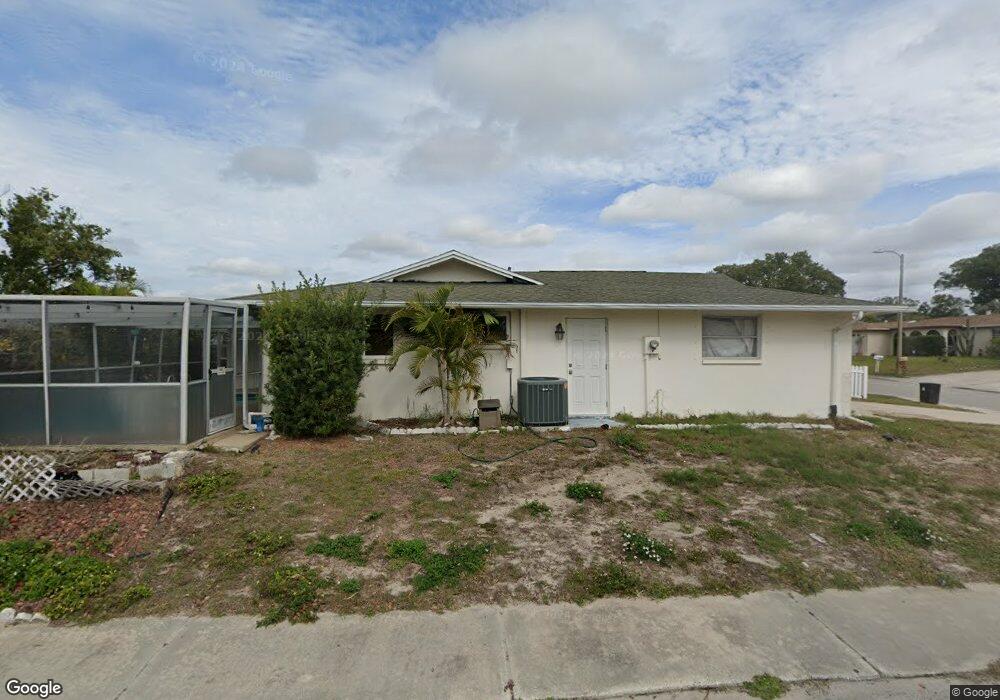
3619 Odom Dr New Port Richey, FL 34652
Estimated Value: $256,000 - $331,000
3
Beds
2
Baths
1,684
Sq Ft
$175/Sq Ft
Est. Value
About This Home
This home is located at 3619 Odom Dr, New Port Richey, FL 34652 and is currently estimated at $294,979, approximately $175 per square foot. 3619 Odom Dr is a home located in Pasco County with nearby schools including Anclote Elementary School, Gulf Middle School, and Gulf High School.
Ownership History
Date
Name
Owned For
Owner Type
Purchase Details
Closed on
Jan 14, 2015
Sold by
Nemeth Steven and Nemeth Barbara
Bought by
Vander Henst Herbert and Van Der Henst Shannon R
Current Estimated Value
Home Financials for this Owner
Home Financials are based on the most recent Mortgage that was taken out on this home.
Original Mortgage
$94,519
Outstanding Balance
$72,770
Interest Rate
3.98%
Mortgage Type
VA
Estimated Equity
$222,209
Purchase Details
Closed on
Dec 12, 1995
Sold by
Joseph K Hadeka Tr
Bought by
Nemeth Steven and Nemeth Barbara
Home Financials for this Owner
Home Financials are based on the most recent Mortgage that was taken out on this home.
Original Mortgage
$55,200
Interest Rate
7.4%
Mortgage Type
New Conventional
Purchase Details
Closed on
Jul 26, 1995
Sold by
Hadeka Joseph K
Bought by
Hadeka Joseph K
Create a Home Valuation Report for This Property
The Home Valuation Report is an in-depth analysis detailing your home's value as well as a comparison with similar homes in the area
Home Values in the Area
Average Home Value in this Area
Purchase History
| Date | Buyer | Sale Price | Title Company |
|---|---|---|---|
| Vander Henst Herbert | $91,500 | 1St Affiliated Title Service | |
| Nemeth Steven | $69,000 | -- | |
| Hadeka Joseph K | -- | -- |
Source: Public Records
Mortgage History
| Date | Status | Borrower | Loan Amount |
|---|---|---|---|
| Open | Vander Henst Herbert | $94,519 | |
| Previous Owner | Nemeth Steven | $66,500 | |
| Previous Owner | Nemeth Steven | $55,200 |
Source: Public Records
Tax History Compared to Growth
Tax History
| Year | Tax Paid | Tax Assessment Tax Assessment Total Assessment is a certain percentage of the fair market value that is determined by local assessors to be the total taxable value of land and additions on the property. | Land | Improvement |
|---|---|---|---|---|
| 2025 | $4,300 | $254,953 | $39,474 | $215,479 |
| 2024 | $4,300 | $269,574 | $36,984 | $232,590 |
| 2023 | $3,994 | $202,480 | $0 | $0 |
| 2022 | $3,140 | $190,546 | $24,656 | $165,890 |
| 2021 | $2,876 | $167,347 | $19,559 | $147,788 |
| 2020 | $991 | $89,730 | $12,625 | $77,105 |
| 2019 | $963 | $87,720 | $0 | $0 |
| 2018 | $936 | $86,085 | $0 | $0 |
| 2017 | $920 | $85,765 | $0 | $0 |
| 2016 | $864 | $82,273 | $12,625 | $69,648 |
| 2015 | $691 | $65,412 | $0 | $0 |
| 2014 | $671 | $64,893 | $11,854 | $53,039 |
Source: Public Records
Map
Nearby Homes
- 3547 Odom Dr Unit 20
- 3633 Blackhawk Dr
- 5714 Marble Dr
- 3801 Golden Shiner Ln
- 5642 Dove Dr
- 6068 Apple Snail Ave
- 5703 Andrea Dr
- 3735 Mynabird Dr
- 5608 Perkin Dr
- 3802 Mynabird Dr
- 3339 Ocio St
- 3841 Chaffey Dr
- 3236 Madison St
- 5543 Moog Rd
- 5817 Elena Dr
- 0 Sr 54 Dr Unit MFRU8195308
- 3539 Anniversary Ct
- 0 Grand Blvd
- 3884 Hanover Dr
- 4061 Hanover Dr