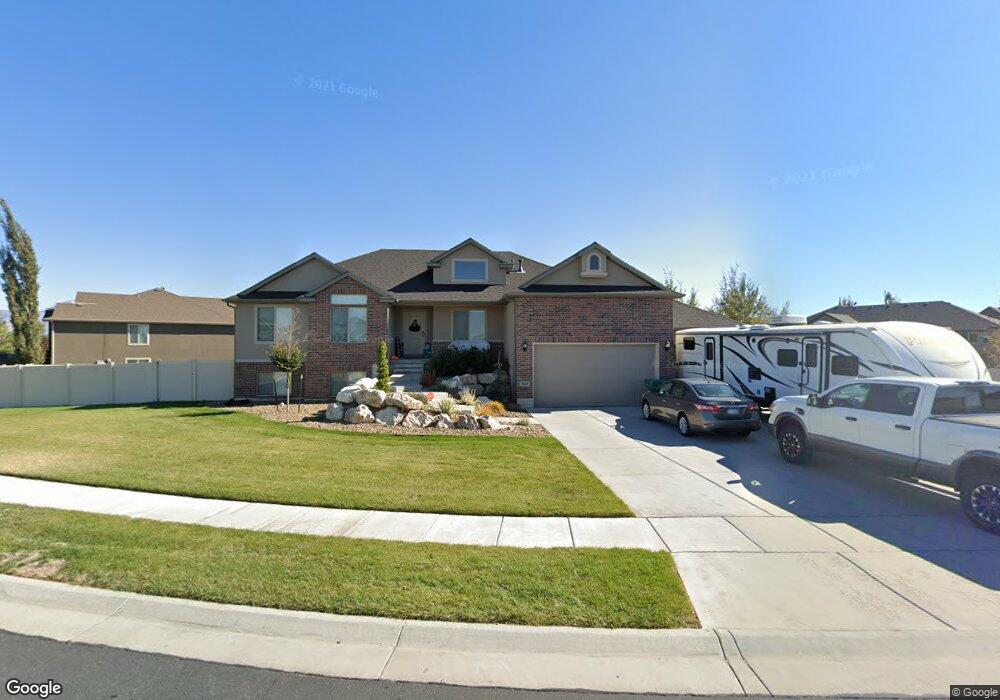
3619 S 4890 W Unit 8 West Haven, UT 84401
Estimated Value: $689,000 - $754,000
7
Beds
3
Baths
3,464
Sq Ft
$208/Sq Ft
Est. Value
About This Home
This home is located at 3619 S 4890 W Unit 8, West Haven, UT 84401 and is currently estimated at $721,232, approximately $208 per square foot. 3619 S 4890 W Unit 8 is a home located in Weber County with nearby schools including Country View School, Rocky Mountain Junior High School, and Fremont High School.
Ownership History
Date
Name
Owned For
Owner Type
Purchase Details
Closed on
Feb 7, 2023
Sold by
Brown Brandon
Bought by
Pease Tannin and Pease Kathryn
Current Estimated Value
Home Financials for this Owner
Home Financials are based on the most recent Mortgage that was taken out on this home.
Original Mortgage
$578,100
Outstanding Balance
$559,162
Interest Rate
6.09%
Mortgage Type
New Conventional
Estimated Equity
$162,070
Purchase Details
Closed on
Jun 24, 2014
Sold by
Nilson And Company Inc
Bought by
Brown Brandon and Brown Angela
Home Financials for this Owner
Home Financials are based on the most recent Mortgage that was taken out on this home.
Original Mortgage
$327,085
Interest Rate
4.17%
Mortgage Type
New Conventional
Purchase Details
Closed on
Jul 19, 2013
Sold by
Winchester Land Company Llc
Bought by
Nilson And Company Inc and Nilson Homes
Purchase Details
Closed on
Jul 17, 2013
Sold by
Smith Lowell V and Smith Rebecca L
Bought by
Winchester Land Company Llc
Create a Home Valuation Report for This Property
The Home Valuation Report is an in-depth analysis detailing your home's value as well as a comparison with similar homes in the area
Home Values in the Area
Average Home Value in this Area
Purchase History
| Date | Buyer | Sale Price | Title Company |
|---|---|---|---|
| Pease Tannin | -- | Amicus Title | |
| Brown Brandon | -- | Bonneville Superior Title Co | |
| Nilson And Company Inc | -- | Founders Title Co Syracuse | |
| Winchester Land Company Llc | -- | Founders Title Co Syracuse | |
| Smith Lowell | -- | Founders Title Company Syrac |
Source: Public Records
Mortgage History
| Date | Status | Borrower | Loan Amount |
|---|---|---|---|
| Open | Pease Tannin | $578,100 | |
| Previous Owner | Brown Brandon | $327,085 |
Source: Public Records
Tax History Compared to Growth
Tax History
| Year | Tax Paid | Tax Assessment Tax Assessment Total Assessment is a certain percentage of the fair market value that is determined by local assessors to be the total taxable value of land and additions on the property. | Land | Improvement |
|---|---|---|---|---|
| 2025 | $4,007 | $674,643 | $248,908 | $425,735 |
| 2024 | $3,838 | $365,199 | $136,756 | $228,443 |
| 2023 | $3,702 | $352,000 | $136,496 | $215,504 |
| 2022 | $4,184 | $411,575 | $136,496 | $275,079 |
| 2021 | $3,238 | $533,000 | $117,563 | $415,437 |
| 2020 | $2,888 | $433,000 | $97,496 | $335,504 |
| 2019 | $2,946 | $419,000 | $92,056 | $326,944 |
| 2018 | $2,916 | $397,000 | $92,056 | $304,944 |
| 2017 | $2,754 | $364,000 | $76,278 | $287,722 |
| 2016 | $2,524 | $180,518 | $34,667 | $145,851 |
| 2015 | $2,476 | $176,235 | $37,329 | $138,906 |
| 2014 | $1,009 | $63,030 | $63,030 | $0 |
Source: Public Records
Map
Nearby Homes
- 4941 W 3575 S
- 3731 S 4975 W
- 3660 S 4700 W
- 3243 S 4950 W Unit 25
- 3263 S 4950 W Unit 24
- 3225 S 4950 W Unit 26
- 3198 S 4950 W Unit 29
- 3192 S 4950 W Unit 28
- 3238 S 4950 W
- 3233 S 4975 W Unit 14
- 3223 S 4975 W Unit 15
- 3257 S 4975 W Unit 12
- 3269 S 4975 W Unit 11
- 3678 S 4625 W Unit 225
- 3686 S 4625 W Unit 227
- 3690 S 4625 W Unit 228
- 4622 W 3725 S Unit 231
- 4589 W 3725 S Unit 248
- 4585 W 3725 S Unit 246
- 3549 S 4450 W
- 3619 S 4890 W
- 4885 W 3615 S
- 4885 W 3615 S Unit 9
- 3611 S 4890 W
- 4865 W 3615 S
- 3580 S 4890 W
- 3580 S 4890 W Unit 7
- 4862 W 3625 S Unit 80
- 4902 W 3625 S
- 4838 W 3625 S
- 3571 S 4890 W
- 3571 S 4890 W Unit 2
- 4864 W 3615 S Unit 23
- 3576 S 4900 W
- 4847 W 3615 S Unit 11
- 4899 W 3575 St S
- 4920 W 3625 S
- 4920 W 3625 S Unit 38
- 3568 S 4900 W
- 3555 S 4890 W