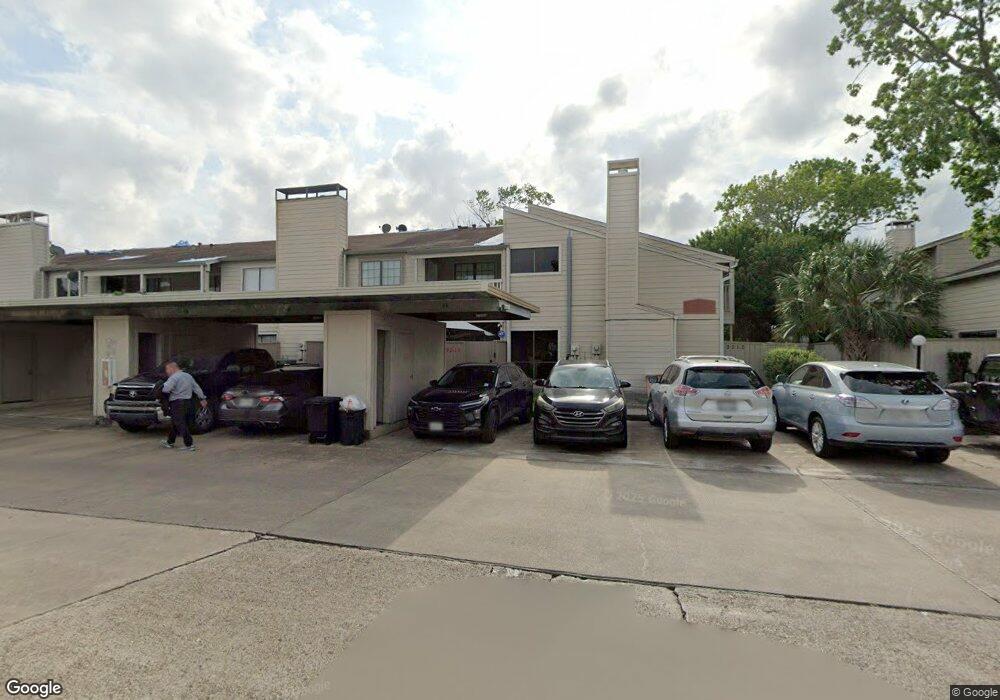
3619 Tanglewilde St Unit 3619 Houston, TX 77063
Mid West NeighborhoodEstimated Value: $127,491 - $152,000
3
Beds
3
Baths
1,532
Sq Ft
$91/Sq Ft
Est. Value
About This Home
This home is located at 3619 Tanglewilde St Unit 3619, Houston, TX 77063 and is currently estimated at $139,873, approximately $91 per square foot. 3619 Tanglewilde St Unit 3619 is a home located in Harris County with nearby schools including Emerson Elementary School, Paul Revere Middle School, and Wisdom High School.
Ownership History
Date
Name
Owned For
Owner Type
Purchase Details
Closed on
Sep 12, 2024
Sold by
Raza Trading Inc
Bought by
Galloway James L
Current Estimated Value
Purchase Details
Closed on
Nov 1, 2012
Sold by
Khan Shafqat A and Khan Osman S
Bought by
Raza Trading Inc
Purchase Details
Closed on
Oct 2, 2003
Sold by
Equicap Real Estate Fund Ii Lp
Bought by
Khan Shafqat and Khan Rukhsana W
Home Financials for this Owner
Home Financials are based on the most recent Mortgage that was taken out on this home.
Original Mortgage
$52,800
Interest Rate
6.24%
Mortgage Type
Purchase Money Mortgage
Purchase Details
Closed on
Aug 3, 1998
Sold by
Anglin Wanda R and Piper Frank W
Bought by
Blythe Noble B
Home Financials for this Owner
Home Financials are based on the most recent Mortgage that was taken out on this home.
Original Mortgage
$35,100
Interest Rate
6.94%
Mortgage Type
Purchase Money Mortgage
Create a Home Valuation Report for This Property
The Home Valuation Report is an in-depth analysis detailing your home's value as well as a comparison with similar homes in the area
Home Values in the Area
Average Home Value in this Area
Purchase History
| Date | Buyer | Sale Price | Title Company |
|---|---|---|---|
| Galloway James L | $1,000 | None Listed On Document | |
| Raza Trading Inc | $45,000 | None Available | |
| Khan Shafqat | -- | Stewart Title Houston Div | |
| Blythe Noble B | -- | -- |
Source: Public Records
Mortgage History
| Date | Status | Borrower | Loan Amount |
|---|---|---|---|
| Previous Owner | Khan Shafqat | $52,800 | |
| Previous Owner | Blythe Noble B | $35,100 |
Source: Public Records
Tax History Compared to Growth
Tax History
| Year | Tax Paid | Tax Assessment Tax Assessment Total Assessment is a certain percentage of the fair market value that is determined by local assessors to be the total taxable value of land and additions on the property. | Land | Improvement |
|---|---|---|---|---|
| 2025 | $2,522 | $117,043 | $22,238 | $94,805 |
| 2024 | $2,522 | $120,544 | $22,903 | $97,641 |
| 2023 | $2,522 | $120,544 | $22,903 | $97,641 |
| 2022 | $2,566 | $116,531 | $22,632 | $93,899 |
| 2021 | $2,366 | $101,507 | $19,286 | $82,221 |
| 2020 | $2,114 | $87,300 | $18,145 | $69,155 |
| 2019 | $2,013 | $79,540 | $17,310 | $62,230 |
| 2018 | $2,156 | $85,193 | $16,187 | $69,006 |
| 2017 | $2,154 | $85,193 | $16,187 | $69,006 |
| 2016 | $2,048 | $80,979 | $15,386 | $65,593 |
| 2015 | $1,285 | $71,638 | $13,611 | $58,027 |
| 2014 | $1,285 | $50,000 | $9,500 | $40,500 |
Source: Public Records
Map
Nearby Homes
- 3615 Tanglewilde St Unit 3615
- 3605 Tanglewilde St Unit 3605
- 9556 Windswept Ln Unit 9556
- 9527 Windswept Ln Unit 9527
- 9506 Pagewood Ln Unit 9506
- 3752 Tanglewilde St Unit B3
- 3768 Tanglewilde St Unit J5
- 3875 Tanglewilde St Unit 3875
- 3754 Tanglewilde St Unit C3
- 3754 Tanglewilde St Unit 9
- 3764 Tanglewilde St Unit 7
- 9519 Pagewood Ln Unit 9519
- 9538 Skyline Dr
- 9431 Pagewood Ln
- 9433 Pagewood Ln
- 3800 Tanglewilde St Unit 109
- 3800 Tanglewilde St Unit 803
- 3800 Tanglewilde St Unit 605
- 3800 Tanglewilde St Unit 607
- 4001 Tanglewilde St Unit 1204
- 3607 Tanglewilde St Unit 3607
- 3617 Tanglewilde St Unit 3617
- 3621 Tanglewilde St Unit 3621
- 3609 Tanglewilde St Unit 3609
- 3603 Tanglewilde St Unit 3603
- 3623 Tanglewilde St Unit 3623
- 3611 Tanglewilde St Unit 3611
- 3613 Tanglewilde St Unit 3613
- 3601 Tanglewilde St Unit 3601
- 9554 Windswept Ln Unit 9554
- 9552 Windswept Ln Unit 9552
- 9558 Windswept Ln Unit 9558
- 9550 Windswept Ln Unit 9550
- 9560 Windswept Ln Unit 9560
- 3523 Tanglewilde St Unit 3523
- 3511 Tanglewilde St Unit 3511
- 9580 Windswept Ln Unit 9580
- 9578 Windswept Ln Unit 9578
- 9582 Windswept Ln Unit 9582
- 9576 Windswept Ln Unit 9576