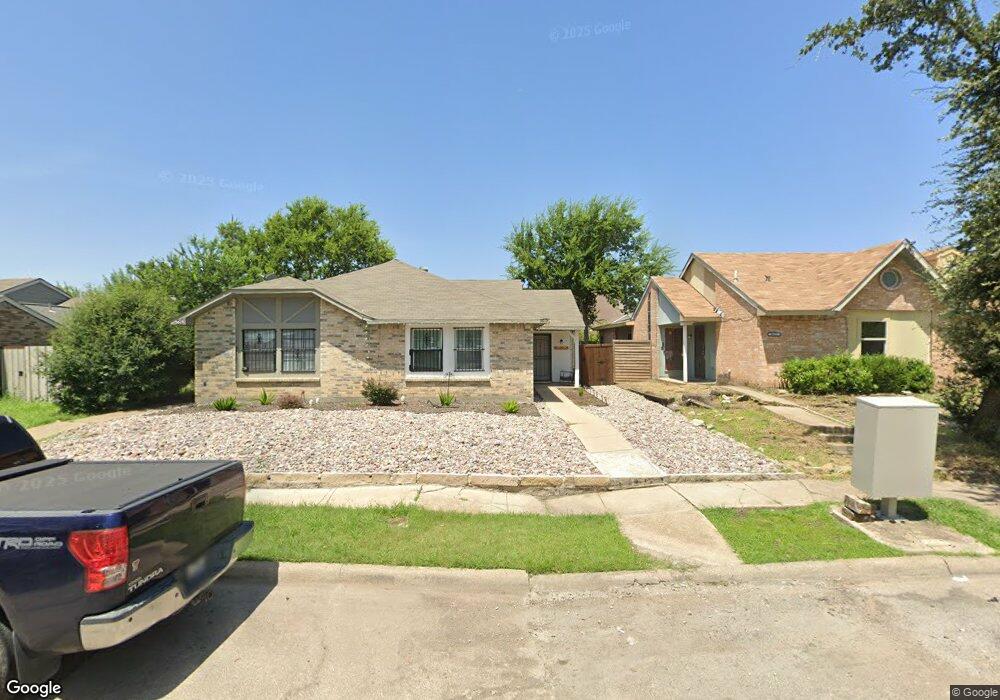
3619 Wilbarger Dr Unit 3619 Dallas, TX 75227
Riverway Estates NeighborhoodEstimated Value: $180,000 - $198,000
2
Beds
2
Baths
1,192
Sq Ft
$160/Sq Ft
Est. Value
About This Home
This home is located at 3619 Wilbarger Dr Unit 3619, Dallas, TX 75227 and is currently estimated at $190,407, approximately $159 per square foot. 3619 Wilbarger Dr Unit 3619 is a home located in Dallas County with nearby schools including C.A. Tatum Jr. Elementary School, Ann Richards STEAM Academy, and Skyline High School.
Ownership History
Date
Name
Owned For
Owner Type
Purchase Details
Closed on
Aug 17, 2017
Sold by
Advance Empire Group Inc
Bought by
Alna Properties Ii Llc
Current Estimated Value
Purchase Details
Closed on
May 13, 2015
Sold by
Unique Drywall Inc
Bought by
Advance Empire Group Inc
Purchase Details
Closed on
Jul 7, 2009
Sold by
Aurora Loan Services Llc
Bought by
Unique Drywall Inc
Purchase Details
Closed on
Apr 10, 2009
Sold by
Halsey Sharon
Bought by
Aurora Loan Services Llc
Purchase Details
Closed on
Jan 7, 2005
Sold by
Mcanalley E R and Mcanalley Lynley K
Bought by
Maisch David F
Home Financials for this Owner
Home Financials are based on the most recent Mortgage that was taken out on this home.
Original Mortgage
$59,900
Interest Rate
6.62%
Mortgage Type
Purchase Money Mortgage
Create a Home Valuation Report for This Property
The Home Valuation Report is an in-depth analysis detailing your home's value as well as a comparison with similar homes in the area
Home Values in the Area
Average Home Value in this Area
Purchase History
| Date | Buyer | Sale Price | Title Company |
|---|---|---|---|
| Alna Properties Ii Llc | -- | Chicago Title | |
| Advance Empire Group Inc | -- | None Available | |
| Unique Drywall Inc | -- | Lsi Title Agency Inc | |
| Aurora Loan Services Llc | $27,000 | None Available | |
| Maisch David F | -- | -- |
Source: Public Records
Mortgage History
| Date | Status | Borrower | Loan Amount |
|---|---|---|---|
| Previous Owner | Maisch David F | $59,900 | |
| Closed | Maisch David F | $15,000 |
Source: Public Records
Tax History Compared to Growth
Tax History
| Year | Tax Paid | Tax Assessment Tax Assessment Total Assessment is a certain percentage of the fair market value that is determined by local assessors to be the total taxable value of land and additions on the property. | Land | Improvement |
|---|---|---|---|---|
| 2025 | $3,981 | $178,100 | $40,000 | $138,100 |
| 2024 | $3,981 | $178,100 | $40,000 | $138,100 |
| 2023 | $3,981 | $146,440 | $30,000 | $116,440 |
| 2022 | $1,766 | $70,640 | $14,000 | $56,640 |
| 2021 | $1,863 | $70,640 | $14,000 | $56,640 |
| 2020 | $1,628 | $60,000 | $0 | $0 |
| 2019 | $1,562 | $54,900 | $12,000 | $42,900 |
| 2018 | $1,688 | $62,080 | $12,000 | $50,080 |
| 2017 | $641 | $23,580 | $9,500 | $14,080 |
| 2016 | $641 | $23,580 | $9,500 | $14,080 |
| 2015 | $607 | $23,580 | $9,500 | $14,080 |
| 2014 | $607 | $22,120 | $9,500 | $12,620 |
Source: Public Records
Map
Nearby Homes
- 9412 Jill Ln
- 9523 Brewster St
- 3416 Pruitt Ave
- 3840 Scarsdale Ln
- 9556 Gonzales Dr
- 9531 Culberson St
- 9402 Scyene Rd
- 9520 Scyene Rd
- 3503 Ridge Crossing Dr
- 3324 Poplar Springs Ln
- 9416 Cedar Run Dr
- 9408 Cedar Run Dr
- 3610 Apple Valley Way
- 8901 Military Pkwy Unit A
- 2933 Curvilinear Ct
- 9922 Ironhorse Dr
- 9930 Ironhorse Dr
- 8627 Cedar Post Ct
- 2820 Blanton St
- 2640 Cypress Ave
- 3619 Wilbarger Dr
- 3619 Wilbarger Dr Unit 3615
- 3623 Wilbarger Dr
- 3615 Wilbarger Dr
- 3615 Wilbarger Dr Unit 3615 & 3619
- 3615 Wilbarger Dr Unit 3619
- 3627 Wilbarger Dr
- 3611 Wilbarger Dr
- 3607 Wilbarger Dr
- 3631 Wilbarger Dr
- 3603 Wilbarger Dr
- 9401 Ector Ct
- 3635 Wilbarger Dr
- 9402 Ector Ct
- 3551 Wilbarger Dr
- 3547 Wilbarger Dr
- 3630 Wilbarger Dr
- 9403 Ector Ct
- 3614 Wilbarger Dr
- 9404 Ector Ct