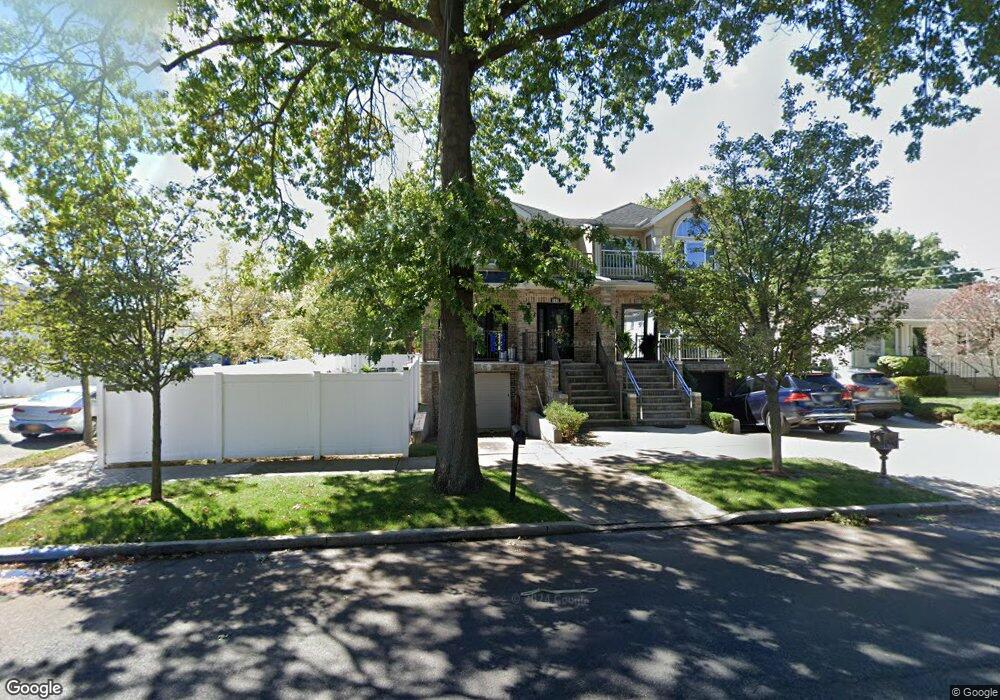
362 Guyon Ave Staten Island, NY 10306
Oakwood NeighborhoodEstimated Value: $754,275 - $1,124,000
3
Beds
3
Baths
2,835
Sq Ft
$332/Sq Ft
Est. Value
About This Home
This home is located at 362 Guyon Ave, Staten Island, NY 10306 and is currently estimated at $941,319, approximately $332 per square foot. 362 Guyon Ave is a home located in Richmond County with nearby schools including P.S. 50 Frank Hankinson School, Myra S. Barnes Intermediate School 24, and New Dorp High School.
Ownership History
Date
Name
Owned For
Owner Type
Purchase Details
Closed on
Oct 20, 2005
Sold by
Guyon Building Llc
Bought by
Giannattasio Antonio and Giannattasio Shannon C
Current Estimated Value
Home Financials for this Owner
Home Financials are based on the most recent Mortgage that was taken out on this home.
Original Mortgage
$599,600
Outstanding Balance
$345,350
Interest Rate
6.99%
Mortgage Type
Fannie Mae Freddie Mac
Estimated Equity
$595,969
Create a Home Valuation Report for This Property
The Home Valuation Report is an in-depth analysis detailing your home's value as well as a comparison with similar homes in the area
Home Values in the Area
Average Home Value in this Area
Purchase History
| Date | Buyer | Sale Price | Title Company |
|---|---|---|---|
| Giannattasio Antonio | $712,367 | Commonwealth Land Title Insu |
Source: Public Records
Mortgage History
| Date | Status | Borrower | Loan Amount |
|---|---|---|---|
| Open | Giannattasio Antonio | $599,600 |
Source: Public Records
Tax History Compared to Growth
Tax History
| Year | Tax Paid | Tax Assessment Tax Assessment Total Assessment is a certain percentage of the fair market value that is determined by local assessors to be the total taxable value of land and additions on the property. | Land | Improvement |
|---|---|---|---|---|
| 2025 | $7,771 | $43,800 | $8,842 | $34,958 |
| 2024 | $7,783 | $46,740 | $8,286 | $38,454 |
| 2023 | $7,561 | $38,630 | $7,893 | $30,737 |
| 2022 | $6,988 | $38,460 | $9,660 | $28,800 |
| 2021 | $6,932 | $34,380 | $9,660 | $24,720 |
| 2020 | $6,775 | $35,760 | $9,660 | $26,100 |
| 2019 | $6,696 | $37,080 | $9,660 | $27,420 |
| 2018 | $6,461 | $33,156 | $7,561 | $25,595 |
| 2017 | $6,077 | $31,280 | $8,820 | $22,460 |
| 2016 | $5,589 | $29,510 | $9,225 | $20,285 |
| 2015 | $5,038 | $27,840 | $8,040 | $19,800 |
| 2014 | $5,038 | $27,840 | $8,040 | $19,800 |
Source: Public Records
Map
Nearby Homes