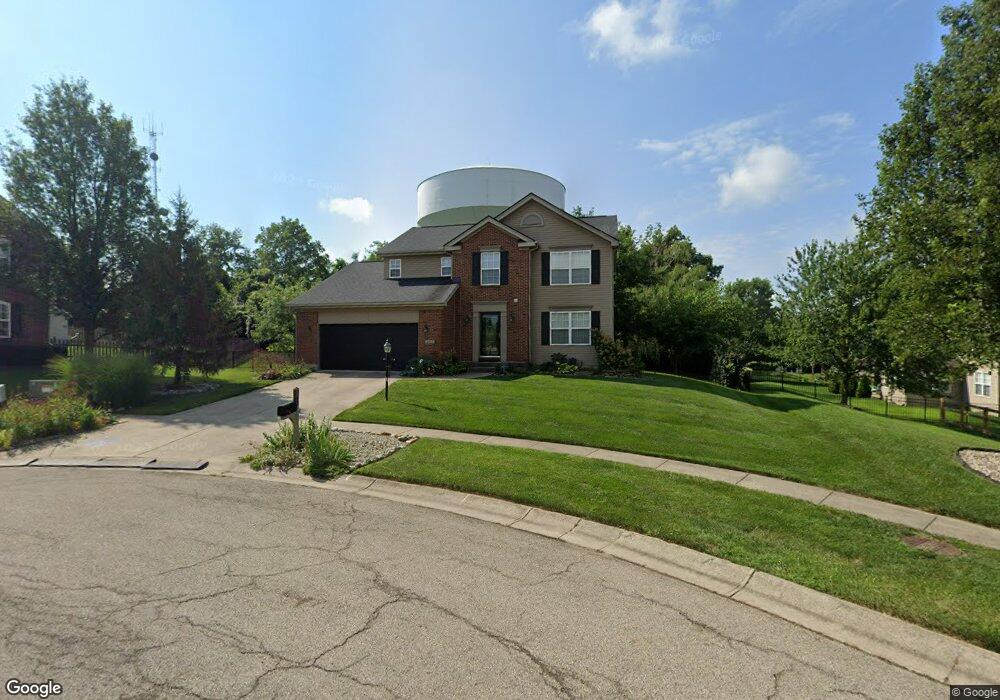
362 Hillcrest Dr Springboro, OH 45066
Estimated Value: $413,131 - $454,000
4
Beds
3
Baths
1,925
Sq Ft
$223/Sq Ft
Est. Value
About This Home
This home is located at 362 Hillcrest Dr, Springboro, OH 45066 and is currently estimated at $429,283, approximately $223 per square foot. 362 Hillcrest Dr is a home located in Warren County with nearby schools including Clearcreek Elementary School, Springboro Intermediate School, and Springboro Junior High School.
Ownership History
Date
Name
Owned For
Owner Type
Purchase Details
Closed on
Mar 17, 2010
Sold by
Keary Stephen W and Keary Katie J
Bought by
Tedrick Cathy J
Current Estimated Value
Home Financials for this Owner
Home Financials are based on the most recent Mortgage that was taken out on this home.
Original Mortgage
$166,133
Outstanding Balance
$110,013
Interest Rate
5.12%
Mortgage Type
FHA
Estimated Equity
$319,270
Purchase Details
Closed on
Sep 29, 2005
Sold by
Inverness Group Inc
Bought by
Keary Stephen W and Keary Katie J
Home Financials for this Owner
Home Financials are based on the most recent Mortgage that was taken out on this home.
Original Mortgage
$220,784
Interest Rate
5.88%
Mortgage Type
Fannie Mae Freddie Mac
Purchase Details
Closed on
Apr 26, 2005
Sold by
Summit Pointe Investors Llc
Bought by
Inverness Group Inc
Home Financials for this Owner
Home Financials are based on the most recent Mortgage that was taken out on this home.
Original Mortgage
$10,000,000
Interest Rate
6.13%
Mortgage Type
Unknown
Create a Home Valuation Report for This Property
The Home Valuation Report is an in-depth analysis detailing your home's value as well as a comparison with similar homes in the area
Home Values in the Area
Average Home Value in this Area
Purchase History
| Date | Buyer | Sale Price | Title Company |
|---|---|---|---|
| Tedrick Cathy J | $169,200 | Midwest Title Company | |
| Keary Stephen W | $232,500 | Sterling Land Title Agency I | |
| Inverness Group Inc | $38,500 | Multiple |
Source: Public Records
Mortgage History
| Date | Status | Borrower | Loan Amount |
|---|---|---|---|
| Open | Tedrick Cathy J | $166,133 | |
| Previous Owner | Keary Stephen W | $220,784 | |
| Previous Owner | Inverness Group Inc | $10,000,000 | |
| Previous Owner | Inverness Group Inc | $15,000,000 |
Source: Public Records
Tax History
| Year | Tax Paid | Tax Assessment Tax Assessment Total Assessment is a certain percentage of the fair market value that is determined by local assessors to be the total taxable value of land and additions on the property. | Land | Improvement |
|---|---|---|---|---|
| 2024 | $4,777 | $117,160 | $35,000 | $82,160 |
| 2023 | $4,200 | $94,272 | $21,525 | $72,747 |
| 2022 | $4,135 | $94,273 | $21,525 | $72,748 |
| 2021 | $3,895 | $94,273 | $21,525 | $72,748 |
| 2020 | $3,664 | $76,643 | $17,500 | $59,143 |
| 2019 | $3,400 | $76,643 | $17,500 | $59,143 |
| 2018 | $3,347 | $76,643 | $17,500 | $59,143 |
| 2017 | $3,308 | $67,008 | $15,533 | $51,475 |
| 2016 | $3,426 | $67,008 | $15,533 | $51,475 |
| 2015 | $3,419 | $67,008 | $15,533 | $51,475 |
| 2014 | $3,419 | $63,820 | $14,790 | $49,020 |
| 2013 | $3,418 | $75,480 | $17,500 | $57,980 |
Source: Public Records
Map
Nearby Homes
- 9048 Thornhill Ct
- 9229 Bennington Way
- 9354 Remington Hill Rd
- 9048 Bedford Ct
- 9195 Glenridge Blvd
- 9279 Maxwells Crossing
- 9378 Remington Hill Rd
- 9079 Bunnell Hill Rd
- 9175 Bunnell Hill Rd
- 22 Patton Dr
- 404 Belleclaire Hill
- 8670 Hawthorne Place
- 251 Fallen Leaf Ct
- 15 Pembrook Dr
- 50 Bentbrook Ct
- 9751 Scotch Pine Dr
- 9161 Remy Ct
- 9101 Remy Ct
- 9823 Scotch Pine Dr
- 1211 Normandy Rue
- 350 Hillcrest Dr
- 338 Hillcrest Dr
- 9048 Highland Cir
- 9042 Highland Cir
- 357 Hillcrest Dr
- 326 Hillcrest Dr
- 9036 Highland Cir
- 325 Hillcrest Dr
- 381 Hillcrest Dr
- 314 Hillcrest Dr
- 9049 Highland Cir
- 9032 Highland Cir
- 9043 Highland Cir
- 302 Hillcrest Dr
- 9280 Crestwood Dr
- 9286 Crestwood Dr
- 9035 Highland Cir
- 302 W Hillcrest Ave
- 9292 Crestwood Dr
- 9062 Thornhill Ct