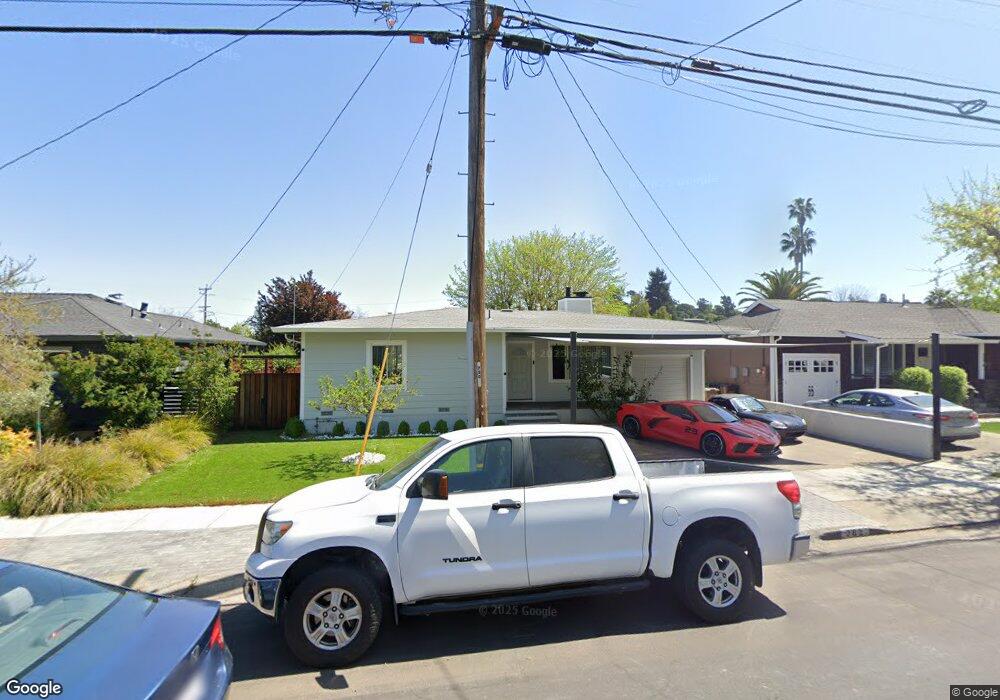
362 Irwin St San Rafael, CA 94901
Picnic Valley NeighborhoodEstimated Value: $1,099,000 - $1,308,000
3
Beds
2
Baths
1,552
Sq Ft
$772/Sq Ft
Est. Value
About This Home
This home is located at 362 Irwin St, San Rafael, CA 94901 and is currently estimated at $1,198,631, approximately $772 per square foot. 362 Irwin St is a home located in Marin County with nearby schools including Laurel Dell Elementary School, Coleman Elementary School, and James B. Davidson Middle School.
Ownership History
Date
Name
Owned For
Owner Type
Purchase Details
Closed on
Aug 8, 2012
Sold by
Henley Michael and Henley Roxann
Bought by
Murad William
Current Estimated Value
Home Financials for this Owner
Home Financials are based on the most recent Mortgage that was taken out on this home.
Original Mortgage
$533,700
Outstanding Balance
$367,280
Interest Rate
3.53%
Mortgage Type
New Conventional
Estimated Equity
$831,351
Purchase Details
Closed on
Jul 22, 2010
Sold by
Henley Michael and Henley Roxann
Bought by
Henley Michael Chester and Henley Roxann
Create a Home Valuation Report for This Property
The Home Valuation Report is an in-depth analysis detailing your home's value as well as a comparison with similar homes in the area
Home Values in the Area
Average Home Value in this Area
Purchase History
| Date | Buyer | Sale Price | Title Company |
|---|---|---|---|
| Murad William | $593,000 | Fidelity National Title Co | |
| Henley Michael Chester | -- | None Available |
Source: Public Records
Mortgage History
| Date | Status | Borrower | Loan Amount |
|---|---|---|---|
| Open | Murad William | $533,700 |
Source: Public Records
Tax History
| Year | Tax Paid | Tax Assessment Tax Assessment Total Assessment is a certain percentage of the fair market value that is determined by local assessors to be the total taxable value of land and additions on the property. | Land | Improvement |
|---|---|---|---|---|
| 2025 | $10,772 | $703,863 | $430,983 | $272,880 |
| 2024 | $10,303 | $690,064 | $422,534 | $267,530 |
| 2023 | $10,097 | $676,534 | $414,249 | $262,285 |
| 2022 | $9,567 | $663,272 | $406,129 | $257,143 |
| 2021 | $9,414 | $650,269 | $398,167 | $252,102 |
| 2020 | $9,327 | $638,655 | $394,086 | $244,569 |
| 2019 | $8,990 | $626,136 | $386,361 | $239,775 |
| 2018 | $8,899 | $613,862 | $378,787 | $235,075 |
| 2017 | $8,571 | $601,826 | $371,360 | $230,466 |
| 2016 | $8,280 | $590,028 | $364,080 | $225,948 |
| 2015 | $7,915 | $581,168 | $358,613 | $222,555 |
| 2014 | $7,582 | $569,785 | $351,589 | $218,196 |
Source: Public Records
Map
Nearby Homes
- 355 Irwin St
- 42 Billou St
- 41 Meadow Ave
- 253 Irwin St
- 215 Bungalow Ave
- 170 Irwin St
- 742 Francisco Blvd W Unit B22
- 742 Francisco Blvd W Unit B12
- 215 Picnic Ave
- 44 Martens Blvd
- 22 Mooring Rd
- 24 Mooring Rd
- 28 Marina Court Dr
- 26 Mooring Rd Unit 1
- 4 Point San Pedro Rd Unit 4
- 11 San Rafael Ave
- 20 Taylor St
- 60 Marina Court Dr
- 42 Grove St
- 1219 Grand Ave Unit 5
Your Personal Tour Guide
Ask me questions while you tour the home.