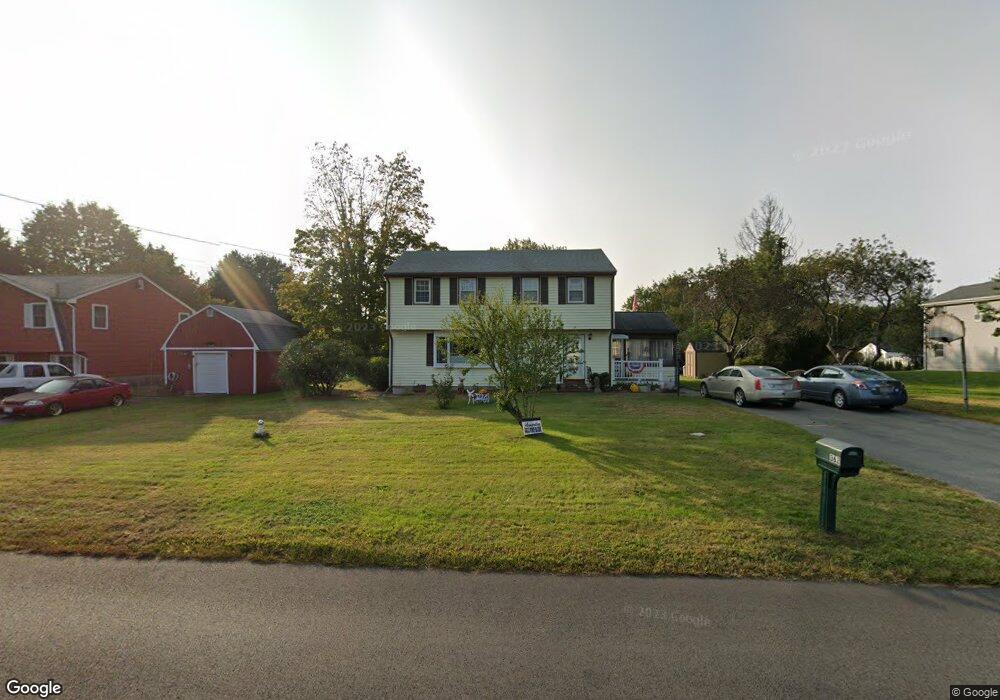
362 Linwood St Abington, MA 02351
Estimated Value: $566,000 - $626,000
4
Beds
2
Baths
1,700
Sq Ft
$354/Sq Ft
Est. Value
About This Home
This home is located at 362 Linwood St, Abington, MA 02351 and is currently estimated at $601,252, approximately $353 per square foot. 362 Linwood St is a home located in Plymouth County with nearby schools including Beaver Brook Elementary School, Woodsdale School, and Abington Middle School.
Ownership History
Date
Name
Owned For
Owner Type
Purchase Details
Closed on
Oct 7, 2021
Sold by
Lynch Margaret A
Bought by
Margaret A Lynch T
Current Estimated Value
Purchase Details
Closed on
Aug 1, 1984
Bought by
Lynch George J and Lynch Margaret
Create a Home Valuation Report for This Property
The Home Valuation Report is an in-depth analysis detailing your home's value as well as a comparison with similar homes in the area
Home Values in the Area
Average Home Value in this Area
Purchase History
| Date | Buyer | Sale Price | Title Company |
|---|---|---|---|
| Margaret A Lynch T | -- | None Available | |
| Lynch George J | $87,000 | -- |
Source: Public Records
Mortgage History
| Date | Status | Borrower | Loan Amount |
|---|---|---|---|
| Previous Owner | Lynch George J | $100,500 | |
| Previous Owner | Lynch George J | $11,841 | |
| Previous Owner | Lynch George J | $80,000 |
Source: Public Records
Tax History Compared to Growth
Tax History
| Year | Tax Paid | Tax Assessment Tax Assessment Total Assessment is a certain percentage of the fair market value that is determined by local assessors to be the total taxable value of land and additions on the property. | Land | Improvement |
|---|---|---|---|---|
| 2025 | $7,007 | $536,500 | $267,000 | $269,500 |
| 2024 | $6,754 | $504,800 | $243,100 | $261,700 |
| 2023 | $6,619 | $465,800 | $221,400 | $244,400 |
| 2022 | $6,418 | $421,700 | $185,100 | $236,600 |
| 2021 | $5,931 | $359,900 | $169,000 | $190,900 |
| 2020 | $6,050 | $355,900 | $170,200 | $185,700 |
| 2019 | $5,850 | $336,400 | $163,300 | $173,100 |
| 2018 | $5,644 | $316,700 | $163,300 | $153,400 |
| 2017 | $5,610 | $305,700 | $163,300 | $142,400 |
| 2016 | $5,108 | $284,900 | $149,100 | $135,800 |
| 2015 | $4,840 | $284,700 | $149,100 | $135,600 |
Source: Public Records
Map
Nearby Homes
- 9 Karen Ln
- 34 George h Gillespie Way
- 164 Hancock St
- 24 Oberlin Rd
- 209 Hancock St
- 79 Groveland St
- 257 Rockland St Unit 257
- 89 Presidential Dr
- 101 Highfields Rd
- 14 Doris Dr
- 65 Leahy Rd
- 209 Bates Rd
- 21 Annette Rd
- 63 Rice St
- 59 Sharon St
- 78 Linda St
- 146 Gloucester St
- 232 Bates Rd
- 16 Davis St
- 37 Rockland St