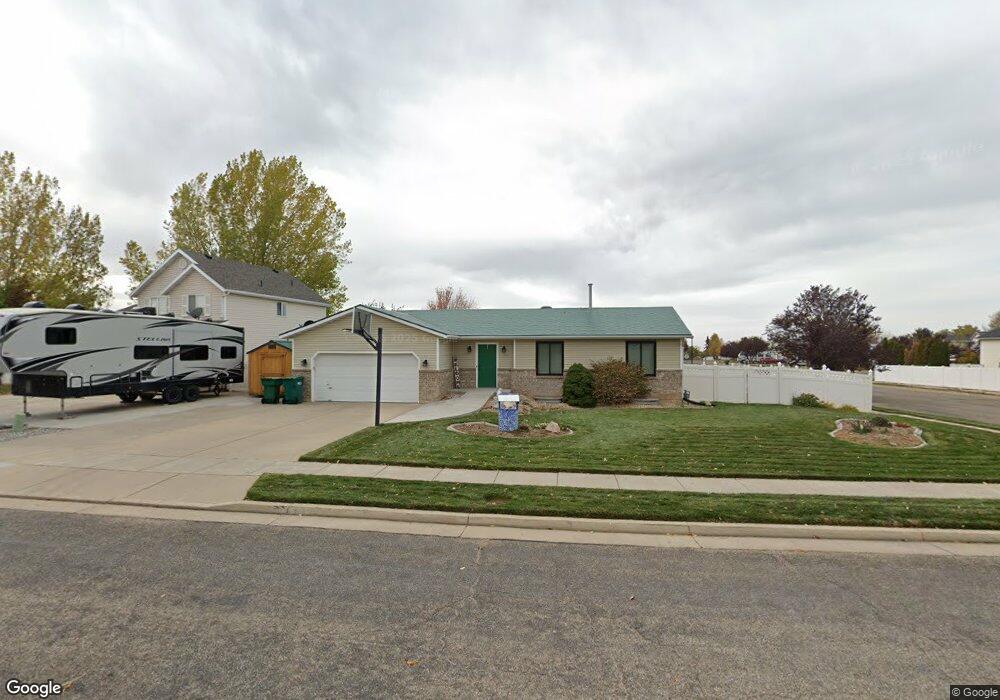
362 N 475 W Clearfield, UT 84015
Estimated Value: $443,000 - $461,000
5
Beds
2
Baths
2,374
Sq Ft
$191/Sq Ft
Est. Value
About This Home
This home is located at 362 N 475 W, Clearfield, UT 84015 and is currently estimated at $454,256, approximately $191 per square foot. 362 N 475 W is a home located in Davis County with nearby schools including Holt Elementary School, North Davis Junior High School, and Clearfield High School.
Ownership History
Date
Name
Owned For
Owner Type
Purchase Details
Closed on
Jun 5, 2012
Sold by
Dayley Douglas A and Dayley Melinda K
Bought by
Olson Steven and Olson Heidi
Current Estimated Value
Home Financials for this Owner
Home Financials are based on the most recent Mortgage that was taken out on this home.
Original Mortgage
$183,767
Outstanding Balance
$126,664
Interest Rate
3.79%
Mortgage Type
VA
Estimated Equity
$327,592
Purchase Details
Closed on
Jan 30, 1998
Sold by
Wall Brothers Construction Lc
Bought by
Dayley Douglas A and Dayley Melinda K
Home Financials for this Owner
Home Financials are based on the most recent Mortgage that was taken out on this home.
Original Mortgage
$107,873
Interest Rate
6.95%
Mortgage Type
FHA
Purchase Details
Closed on
Jun 11, 1997
Sold by
Wasatch West Lc
Bought by
Wall Neil J
Create a Home Valuation Report for This Property
The Home Valuation Report is an in-depth analysis detailing your home's value as well as a comparison with similar homes in the area
Home Values in the Area
Average Home Value in this Area
Purchase History
| Date | Buyer | Sale Price | Title Company |
|---|---|---|---|
| Olson Steven | -- | Mountain View Title & | |
| Dayley Douglas A | -- | Founders Title Company | |
| Wall Brothers Construction Lc | -- | Founders Title Company | |
| Wall Neil J | -- | Founders Title Company |
Source: Public Records
Mortgage History
| Date | Status | Borrower | Loan Amount |
|---|---|---|---|
| Open | Olson Steven | $183,767 | |
| Previous Owner | Dayley Douglas A | $107,873 |
Source: Public Records
Tax History Compared to Growth
Tax History
| Year | Tax Paid | Tax Assessment Tax Assessment Total Assessment is a certain percentage of the fair market value that is determined by local assessors to be the total taxable value of land and additions on the property. | Land | Improvement |
|---|---|---|---|---|
| 2025 | $2,639 | $236,501 | $71,429 | $165,072 |
| 2024 | $2,541 | $229,350 | $68,269 | $161,081 |
| 2023 | $2,354 | $390,000 | $108,973 | $281,027 |
| 2022 | $2,529 | $226,600 | $62,147 | $164,453 |
| 2021 | $2,334 | $316,000 | $67,462 | $248,538 |
| 2020 | $2,030 | $273,000 | $56,995 | $216,005 |
| 2019 | $1,944 | $258,000 | $58,775 | $199,225 |
| 2018 | $1,802 | $233,000 | $52,169 | $180,831 |
| 2016 | $1,607 | $108,680 | $20,931 | $87,749 |
| 2015 | $1,512 | $97,460 | $20,931 | $76,529 |
| 2014 | $1,505 | $98,306 | $20,931 | $77,375 |
| 2013 | -- | $76,620 | $30,451 | $46,169 |
Source: Public Records
Map
Nearby Homes