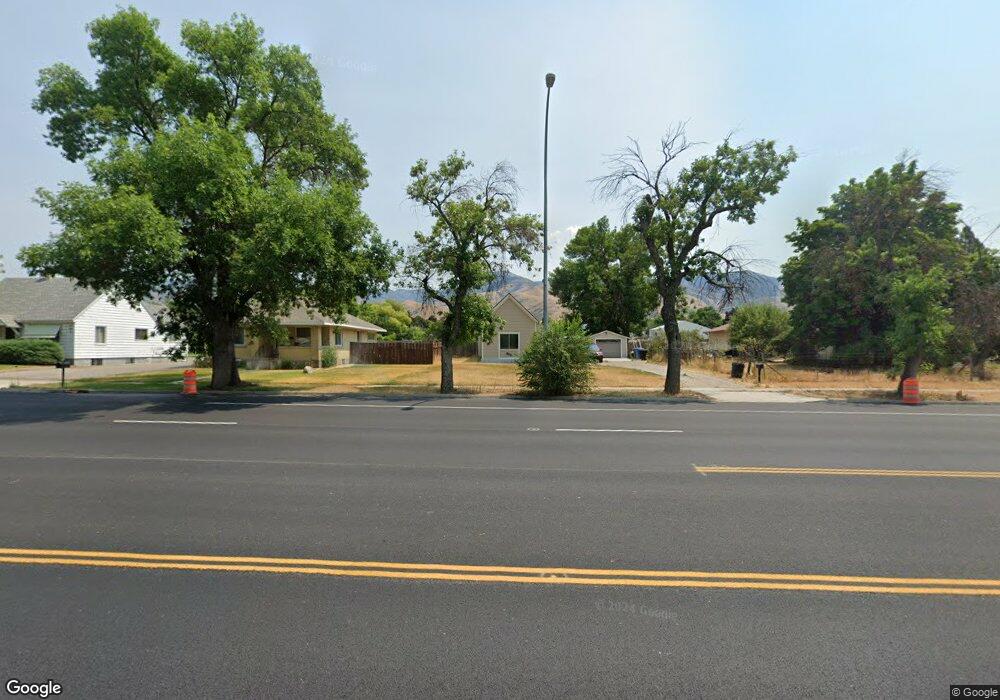
362 N Main St Smithfield, UT 84335
Estimated Value: $235,000 - $362,000
1
Bed
1
Bath
775
Sq Ft
$368/Sq Ft
Est. Value
About This Home
This home is located at 362 N Main St, Smithfield, UT 84335 and is currently estimated at $284,967, approximately $367 per square foot. 362 N Main St is a home located in Cache County with nearby schools including Birch Creek School, North Cache Middle School, and White Pine Middle School.
Ownership History
Date
Name
Owned For
Owner Type
Purchase Details
Closed on
Dec 23, 2020
Sold by
Peterson Rodney J and Peterson Lisa M
Bought by
Silva Gabriela
Current Estimated Value
Home Financials for this Owner
Home Financials are based on the most recent Mortgage that was taken out on this home.
Original Mortgage
$187,878
Outstanding Balance
$167,185
Interest Rate
2.8%
Mortgage Type
USDA
Estimated Equity
$117,782
Purchase Details
Closed on
Mar 2, 2018
Sold by
Peterson Rodney J and Peterson Lisa M
Bought by
Peterson Rodney J and Peterson Fmtr Lisa
Create a Home Valuation Report for This Property
The Home Valuation Report is an in-depth analysis detailing your home's value as well as a comparison with similar homes in the area
Home Values in the Area
Average Home Value in this Area
Purchase History
| Date | Buyer | Sale Price | Title Company |
|---|---|---|---|
| Silva Gabriela | -- | American Secure Title Logan | |
| Peterson Rodney J | -- | None Available |
Source: Public Records
Mortgage History
| Date | Status | Borrower | Loan Amount |
|---|---|---|---|
| Open | Silva Gabriela | $187,878 |
Source: Public Records
Tax History Compared to Growth
Tax History
| Year | Tax Paid | Tax Assessment Tax Assessment Total Assessment is a certain percentage of the fair market value that is determined by local assessors to be the total taxable value of land and additions on the property. | Land | Improvement |
|---|---|---|---|---|
| 2025 | $1,022 | $136,805 | $0 | $0 |
| 2024 | $896 | $112,500 | $0 | $0 |
| 2023 | $947 | $112,460 | $0 | $0 |
| 2022 | $1,196 | $139,735 | $0 | $0 |
| 2021 | $113 | $201,476 | $70,000 | $131,476 |
| 2020 | $1,028 | $171,136 | $70,000 | $101,136 |
| 2019 | $921 | $146,136 | $45,000 | $101,136 |
| 2018 | $881 | $135,300 | $45,000 | $90,300 |
| 2017 | $647 | $54,285 | $0 | $0 |
| 2016 | $659 | $54,285 | $0 | $0 |
| 2015 | $661 | $54,285 | $0 | $0 |
| 2014 | $648 | $54,285 | $0 | $0 |
| 2013 | -- | $54,285 | $0 | $0 |
Source: Public Records
Map
Nearby Homes