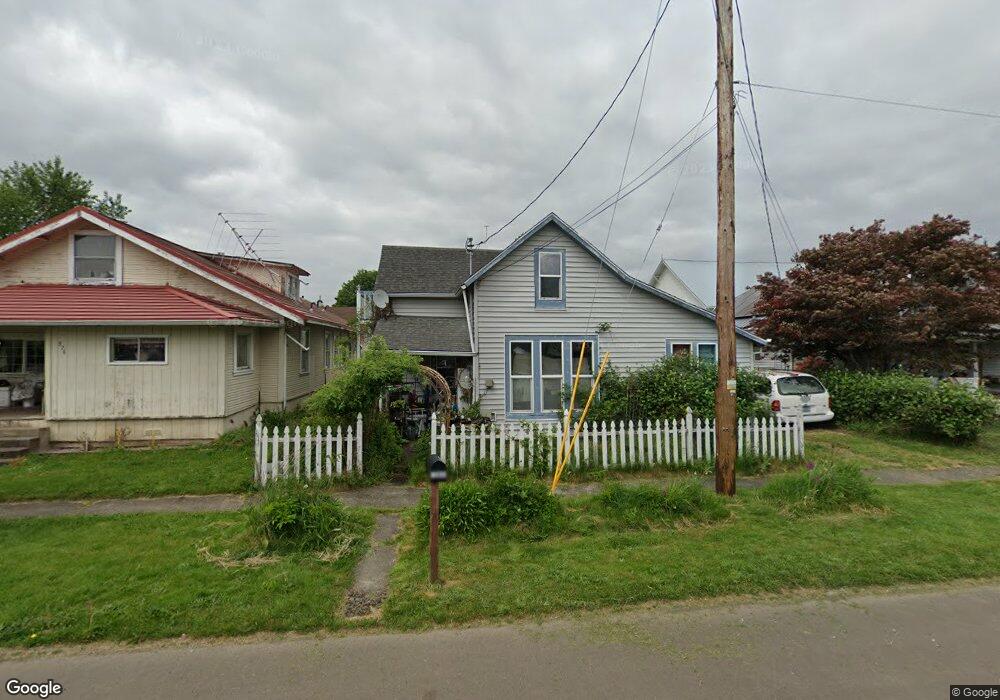
362 North St Vernonia, OR 97064
Estimated Value: $266,000 - $321,000
2
Beds
1
Bath
1,076
Sq Ft
$272/Sq Ft
Est. Value
About This Home
This home is located at 362 North St, Vernonia, OR 97064 and is currently estimated at $292,910, approximately $272 per square foot. 362 North St is a home located in Columbia County with nearby schools including Vernonia High School.
Ownership History
Date
Name
Owned For
Owner Type
Purchase Details
Closed on
Aug 11, 2014
Sold by
Potter Matthew D K
Bought by
Potter Matthew D K and Potter Andrea M
Current Estimated Value
Purchase Details
Closed on
Feb 26, 2013
Sold by
The Secretary Of Housing & Urban Develop
Bought by
Potter Matthew Dk
Purchase Details
Closed on
Mar 13, 2006
Sold by
Owens Daniel L and Owens Aurora B
Bought by
Elstad Peter A and Elstad Cara A
Home Financials for this Owner
Home Financials are based on the most recent Mortgage that was taken out on this home.
Original Mortgage
$108,480
Interest Rate
8.62%
Mortgage Type
Commercial
Create a Home Valuation Report for This Property
The Home Valuation Report is an in-depth analysis detailing your home's value as well as a comparison with similar homes in the area
Home Values in the Area
Average Home Value in this Area
Purchase History
| Date | Buyer | Sale Price | Title Company |
|---|---|---|---|
| Potter Matthew D K | $43,000 | None Available | |
| Potter Matthew Dk | $43,000 | Ticor Title | |
| Elstad Peter A | $135,600 | Columbia County Title |
Source: Public Records
Mortgage History
| Date | Status | Borrower | Loan Amount |
|---|---|---|---|
| Previous Owner | Elstad Peter A | $108,480 |
Source: Public Records
Tax History Compared to Growth
Tax History
| Year | Tax Paid | Tax Assessment Tax Assessment Total Assessment is a certain percentage of the fair market value that is determined by local assessors to be the total taxable value of land and additions on the property. | Land | Improvement |
|---|---|---|---|---|
| 2024 | $1,612 | $88,260 | $47,700 | $40,560 |
| 2023 | $1,591 | $85,690 | $41,430 | $44,260 |
| 2022 | $1,517 | $83,200 | $40,220 | $42,980 |
| 2021 | $1,474 | $80,780 | $39,760 | $41,020 |
| 2020 | $1,434 | $78,430 | $37,180 | $41,250 |
| 2019 | $1,330 | $76,150 | $35,800 | $40,350 |
| 2018 | $1,313 | $73,940 | $44,660 | $29,280 |
| 2017 | $1,282 | $71,790 | $43,360 | $28,430 |
| 2016 | $1,206 | $69,700 | $42,090 | $27,610 |
| 2015 | $1,091 | $65,620 | $38,980 | $26,640 |
| 2014 | $1,017 | $59,630 | $35,510 | $24,120 |
Source: Public Records
Map
Nearby Homes