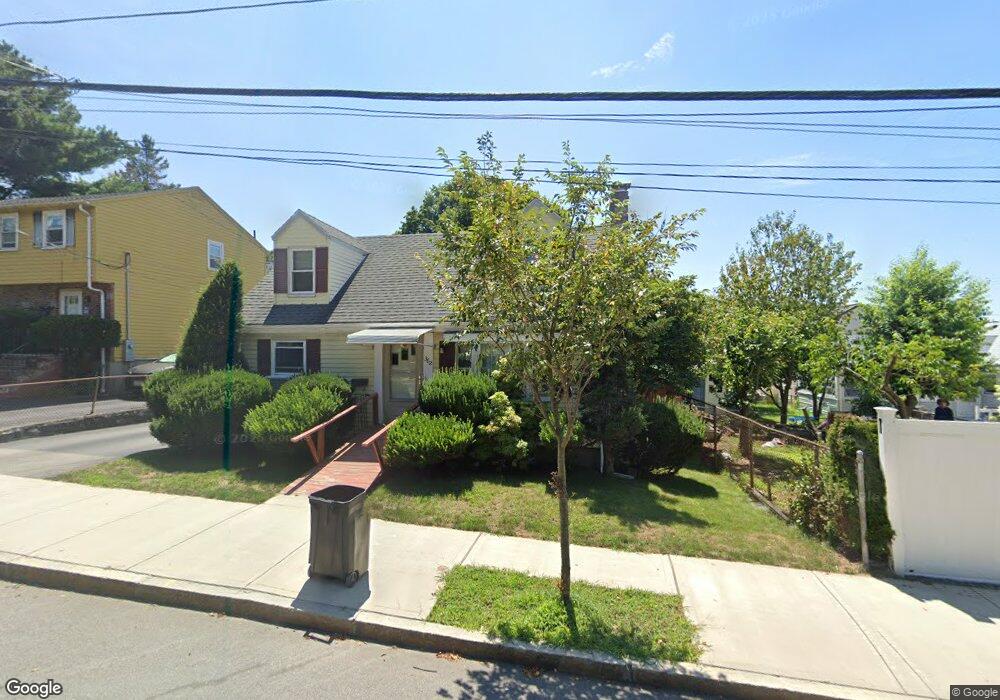
362 Quarry St Quincy, MA 02169
South Quincy NeighborhoodEstimated Value: $631,000 - $658,000
3
Beds
2
Baths
1,400
Sq Ft
$462/Sq Ft
Est. Value
About This Home
This home is located at 362 Quarry St, Quincy, MA 02169 and is currently estimated at $646,437, approximately $461 per square foot. 362 Quarry St is a home located in Norfolk County with nearby schools including Lincoln-Hancock Community School, South West Middle School, and Quincy High School.
Ownership History
Date
Name
Owned For
Owner Type
Purchase Details
Closed on
May 15, 2009
Sold by
Huynh Cuong T
Bought by
Huynh Chuong T
Current Estimated Value
Home Financials for this Owner
Home Financials are based on the most recent Mortgage that was taken out on this home.
Original Mortgage
$144,000
Outstanding Balance
$90,982
Interest Rate
4.85%
Mortgage Type
Purchase Money Mortgage
Estimated Equity
$555,455
Create a Home Valuation Report for This Property
The Home Valuation Report is an in-depth analysis detailing your home's value as well as a comparison with similar homes in the area
Home Values in the Area
Average Home Value in this Area
Purchase History
| Date | Buyer | Sale Price | Title Company |
|---|---|---|---|
| Huynh Chuong T | $180,000 | -- |
Source: Public Records
Mortgage History
| Date | Status | Borrower | Loan Amount |
|---|---|---|---|
| Open | Huynh Chuong T | $144,000 |
Source: Public Records
Tax History Compared to Growth
Tax History
| Year | Tax Paid | Tax Assessment Tax Assessment Total Assessment is a certain percentage of the fair market value that is determined by local assessors to be the total taxable value of land and additions on the property. | Land | Improvement |
|---|---|---|---|---|
| 2025 | $6,036 | $523,500 | $263,200 | $260,300 |
| 2024 | $5,733 | $508,700 | $250,700 | $258,000 |
| 2023 | $5,220 | $469,000 | $227,900 | $241,100 |
| 2022 | $5,245 | $437,800 | $207,200 | $230,600 |
| 2021 | $5,210 | $429,200 | $207,200 | $222,000 |
| 2020 | $5,226 | $420,400 | $197,300 | $223,100 |
| 2019 | $4,805 | $382,900 | $186,200 | $196,700 |
| 2018 | $5,004 | $375,100 | $186,200 | $188,900 |
| 2017 | $4,811 | $339,500 | $177,300 | $162,200 |
| 2016 | $4,600 | $320,300 | $168,800 | $151,500 |
| 2015 | $4,497 | $308,000 | $168,800 | $139,200 |
| 2014 | $4,156 | $279,700 | $160,800 | $118,900 |
Source: Public Records
Map
Nearby Homes
- 1 Cityview Ln Unit 506
- 1 Cityview Ln Unit 210
- 1 Cityview Ln Unit 709
- 73 Connell St
- 25 Carrolls Ln
- 10 White St
- 211 Copeland St
- 89 Puritan Dr
- 46 Suomi Rd
- 46 Suomi Rd Unit 46
- 46-48 Buckley St
- 57 Buckley St
- 14 Arthur Ave
- 12 Arthur Ave
- 42 West St
- 41 Wallace Rd
- 21 Arthur St
- 121 Hillside Ave
- 200 Adams St
- 91 Garfield St