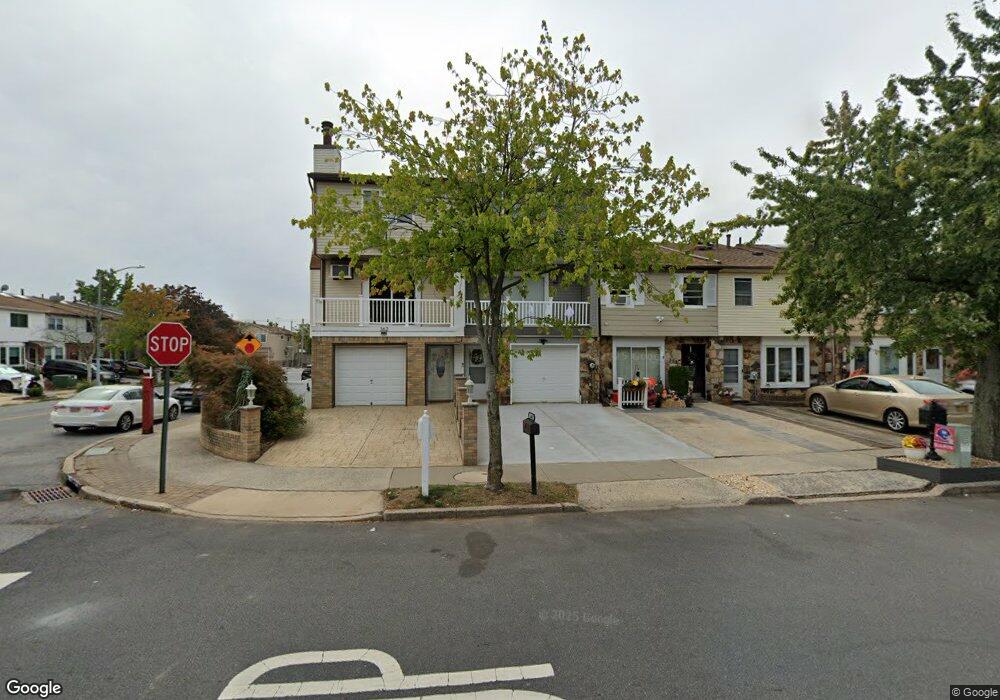
362 Tanglewood Dr Unit 2 Staten Island, NY 10308
Great Kills NeighborhoodEstimated Value: $789,805 - $834,000
3
Beds
3
Baths
2,160
Sq Ft
$379/Sq Ft
Est. Value
About This Home
This home is located at 362 Tanglewood Dr Unit 2, Staten Island, NY 10308 and is currently estimated at $819,451, approximately $379 per square foot. 362 Tanglewood Dr Unit 2 is a home located in Richmond County with nearby schools including P.S. 32 The Gifford School, Myra S. Barnes Intermediate School 24, and Susan E Wagner High School.
Ownership History
Date
Name
Owned For
Owner Type
Purchase Details
Closed on
Mar 16, 2022
Sold by
Calabrese Cory S and Calabrese Maria
Bought by
Chen Dejie and Chen Zhao Kun
Current Estimated Value
Home Financials for this Owner
Home Financials are based on the most recent Mortgage that was taken out on this home.
Original Mortgage
$426,000
Outstanding Balance
$397,706
Interest Rate
3.85%
Mortgage Type
New Conventional
Estimated Equity
$421,745
Purchase Details
Closed on
Aug 28, 2015
Sold by
Palladino Christopher
Bought by
Calabrese Cory S and Calabrese Maria
Home Financials for this Owner
Home Financials are based on the most recent Mortgage that was taken out on this home.
Original Mortgage
$436,507
Interest Rate
3.75%
Mortgage Type
FHA
Purchase Details
Closed on
May 16, 2006
Sold by
Morisi Russ and Morisi Laura
Bought by
Palladino Christopher
Purchase Details
Closed on
Dec 19, 2001
Sold by
Morisi Russ and Morisi Laura
Bought by
Morisi Russ and Morisi Laura
Create a Home Valuation Report for This Property
The Home Valuation Report is an in-depth analysis detailing your home's value as well as a comparison with similar homes in the area
Home Values in the Area
Average Home Value in this Area
Purchase History
| Date | Buyer | Sale Price | Title Company |
|---|---|---|---|
| Chen Dejie | $710,000 | Complete Title Services | |
| Calabrese Cory S | $460,000 | Fidelity Natl Title Ins Co | |
| Palladino Christopher | $439,800 | None Available | |
| Morisi Russ | -- | Title Usa Insurance Corp |
Source: Public Records
Mortgage History
| Date | Status | Borrower | Loan Amount |
|---|---|---|---|
| Open | Chen Dejie | $426,000 | |
| Previous Owner | Calabrese Cory S | $436,507 |
Source: Public Records
Tax History Compared to Growth
Tax History
| Year | Tax Paid | Tax Assessment Tax Assessment Total Assessment is a certain percentage of the fair market value that is determined by local assessors to be the total taxable value of land and additions on the property. | Land | Improvement |
|---|---|---|---|---|
| 2025 | $6,357 | $50,880 | $5,506 | $45,374 |
| 2024 | $6,357 | $41,580 | $6,394 | $35,186 |
| 2023 | $6,064 | $29,860 | $5,905 | $23,955 |
| 2022 | $4,617 | $40,020 | $8,400 | $31,620 |
| 2021 | $5,909 | $36,480 | $8,400 | $28,080 |
| 2020 | $5,883 | $34,440 | $8,400 | $26,040 |
| 2019 | $5,517 | $36,660 | $8,400 | $28,260 |
| 2018 | $5,072 | $24,883 | $7,508 | $17,375 |
| 2017 | $5,056 | $24,804 | $7,160 | $17,644 |
| 2016 | $4,678 | $23,400 | $7,496 | $15,904 |
| 2015 | $4,218 | $23,160 | $7,620 | $15,540 |
| 2014 | $4,218 | $21,979 | $6,726 | $15,253 |
Source: Public Records
Map
Nearby Homes
- 362 Tanglewood Dr
- 360 Tanglewood Dr
- 358 Tanglewood Dr
- 356 Tanglewood Dr
- 354 Tanglewood Dr
- 352 Tanglewood Dr
- 85 Sandalwood Dr
- 81 Sandalwood Dr
- 77 Sandalwood Dr
- 346 Tanglewood Dr
- 73 Sandalwood Dr Unit 1
- 73 Sandalwood Dr
- 59 Ironwood St
- 344 Tanglewood Dr
- 57 Ironwood St
- 61 Ironwood St
- 55 Ironwood St
- 63 Ironwood St
- 49 Ironwood St
- 69 Sandalwood Dr