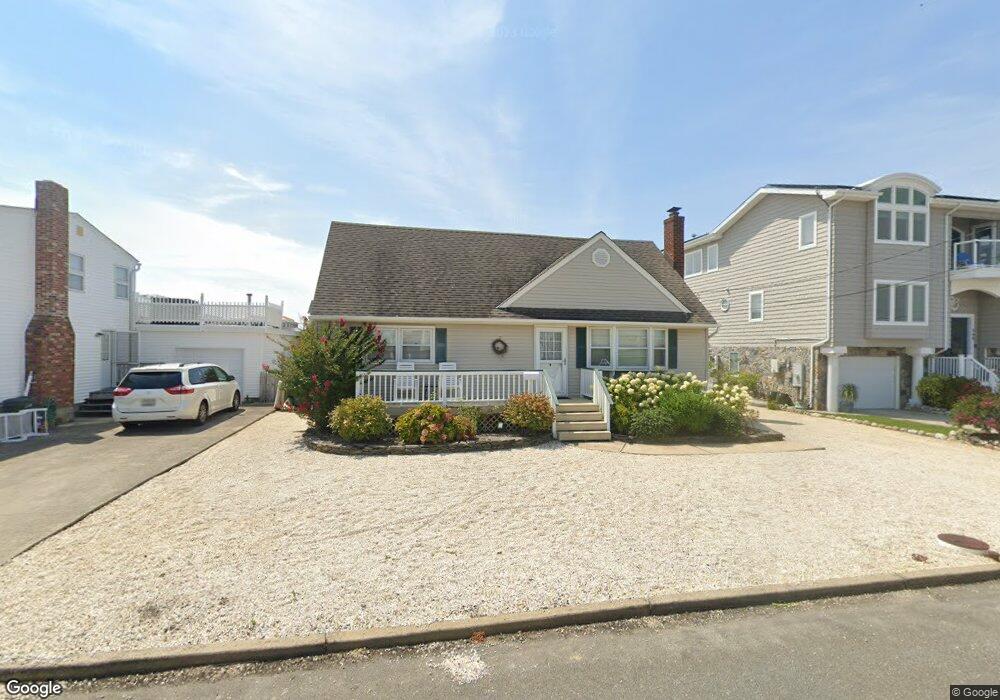
362 W 4th St Ship Bottom, NJ 08008
Long Beach Island NeighborhoodEstimated Value: $1,369,000 - $1,751,000
4
Beds
2
Baths
1,468
Sq Ft
$1,053/Sq Ft
Est. Value
About This Home
This home is located at 362 W 4th St, Ship Bottom, NJ 08008 and is currently estimated at $1,545,854, approximately $1,053 per square foot. 362 W 4th St is a home located in Ocean County with nearby schools including Ethel A. Jacobsen Elementary School, Long Beach Island Grade School, and Southern Regional Middle School.
Ownership History
Date
Name
Owned For
Owner Type
Purchase Details
Closed on
Nov 10, 1997
Sold by
Sinatra Edward and Levine Annette
Bought by
Stoughton Oliver W and Stoughton Susan
Current Estimated Value
Home Financials for this Owner
Home Financials are based on the most recent Mortgage that was taken out on this home.
Original Mortgage
$228,750
Outstanding Balance
$35,794
Interest Rate
6.75%
Estimated Equity
$1,510,060
Create a Home Valuation Report for This Property
The Home Valuation Report is an in-depth analysis detailing your home's value as well as a comparison with similar homes in the area
Home Values in the Area
Average Home Value in this Area
Purchase History
| Date | Buyer | Sale Price | Title Company |
|---|---|---|---|
| Stoughton Oliver W | $305,000 | -- |
Source: Public Records
Mortgage History
| Date | Status | Borrower | Loan Amount |
|---|---|---|---|
| Open | Stoughton Oliver W | $228,750 |
Source: Public Records
Tax History Compared to Growth
Tax History
| Year | Tax Paid | Tax Assessment Tax Assessment Total Assessment is a certain percentage of the fair market value that is determined by local assessors to be the total taxable value of land and additions on the property. | Land | Improvement |
|---|---|---|---|---|
| 2025 | $8,934 | $741,400 | $530,400 | $211,000 |
| 2024 | $8,519 | $741,400 | $530,400 | $211,000 |
| 2023 | $7,851 | $741,400 | $530,400 | $211,000 |
| 2022 | $7,851 | $741,400 | $530,400 | $211,000 |
| 2021 | $7,814 | $741,400 | $530,400 | $211,000 |
| 2020 | $7,837 | $741,400 | $530,400 | $211,000 |
| 2019 | $7,844 | $741,400 | $530,400 | $211,000 |
| 2018 | $7,859 | $741,400 | $530,400 | $211,000 |
| 2017 | $7,347 | $741,400 | $530,400 | $211,000 |
| 2016 | $7,188 | $649,300 | $479,400 | $169,900 |
| 2015 | $7,012 | $649,300 | $479,400 | $169,900 |
| 2014 | $7,006 | $649,300 | $479,400 | $169,900 |
Source: Public Records
Map
Nearby Homes
- 328 W 6th St
- 615 Barnegat Ave
- 379 W 8th St Unit 6
- 249 S 2nd St
- 294 N 2nd St
- 322 N 3rd St
- 272 N 2nd St
- 369 W 10th St
- 242 N 2nd St
- 339 W 11th St
- 401 Boulevard Unit 306
- 401 Boulevard Unit 506
- 401 Boulevard Unit 503
- 401 Boulevard Unit 508
- 401 Boulevard Unit 202
- 401 Boulevard Unit 201
- 605 Long Beach Blvd
- 333 N 5th St
- 2561 2nd St
- 28 Division Ave