Estimated Value: $401,000 - $559,817
3
Beds
2
Baths
1,540
Sq Ft
$324/Sq Ft
Est. Value
About This Home
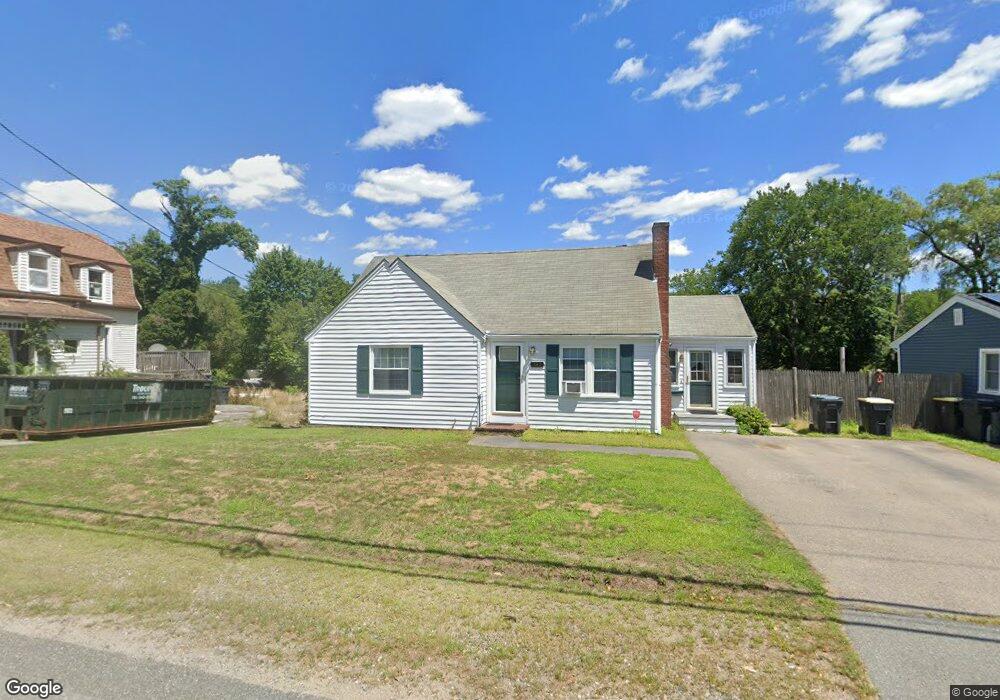
This home is located at 362 W Main St, Avon, MA 02322 and is currently estimated at $498,954, approximately $323 per square foot. 362 W Main St is a home located in Norfolk County with nearby schools including Ralph D. Butler Elementary School and Avon Middle/High School.
Ownership History
Date
Name
Owned For
Owner Type
Purchase Details
Closed on
Dec 28, 2020
Sold by
Lyon Kathleen and Lyon James P
Bought by
Lyon James P
Current Estimated Value
Home Financials for this Owner
Home Financials are based on the most recent Mortgage that was taken out on this home.
Original Mortgage
$272,100
Outstanding Balance
$241,692
Interest Rate
2.7%
Mortgage Type
New Conventional
Estimated Equity
$257,262
Purchase Details
Closed on
Jan 31, 2006
Sold by
Buckley Virginia F
Bought by
Lyons James P and Buccella Kathleen
Home Financials for this Owner
Home Financials are based on the most recent Mortgage that was taken out on this home.
Original Mortgage
$184,000
Interest Rate
6.34%
Mortgage Type
Purchase Money Mortgage
Create a Home Valuation Report for This Property
The Home Valuation Report is an in-depth analysis detailing your home's value as well as a comparison with similar homes in the area
Home Values in the Area
Average Home Value in this Area
Purchase History
| Date | Buyer | Sale Price | Title Company |
|---|---|---|---|
| Lyon James P | -- | None Available | |
| Lyons James P | $230,000 | -- | |
| Lyons James P | $230,000 | -- |
Source: Public Records
Mortgage History
| Date | Status | Borrower | Loan Amount |
|---|---|---|---|
| Open | Lyon James P | $272,100 | |
| Previous Owner | Lyons James P | $184,000 | |
| Previous Owner | Lyons James P | $34,500 | |
| Previous Owner | Lyons James P | $28,200 |
Source: Public Records
Tax History
| Year | Tax Paid | Tax Assessment Tax Assessment Total Assessment is a certain percentage of the fair market value that is determined by local assessors to be the total taxable value of land and additions on the property. | Land | Improvement |
|---|---|---|---|---|
| 2025 | $56 | $418,200 | $178,500 | $239,700 |
| 2024 | $5,362 | $382,200 | $169,100 | $213,100 |
| 2023 | $5,206 | $382,200 | $169,100 | $213,100 |
| 2022 | $5,496 | $347,600 | $140,900 | $206,700 |
| 2021 | $4,735 | $282,200 | $127,900 | $154,300 |
| 2020 | $4,733 | $267,400 | $125,400 | $142,000 |
| 2019 | $4,893 | $272,000 | $125,400 | $146,600 |
| 2018 | $5,001 | $269,600 | $125,400 | $144,200 |
| 2017 | $4,114 | $238,100 | $125,400 | $112,700 |
| 2016 | $4,332 | $253,200 | $125,400 | $127,800 |
| 2015 | $3,868 | $236,300 | $114,000 | $122,300 |
Source: Public Records
Map
Nearby Homes
Your Personal Tour Guide
Ask me questions while you tour the home.