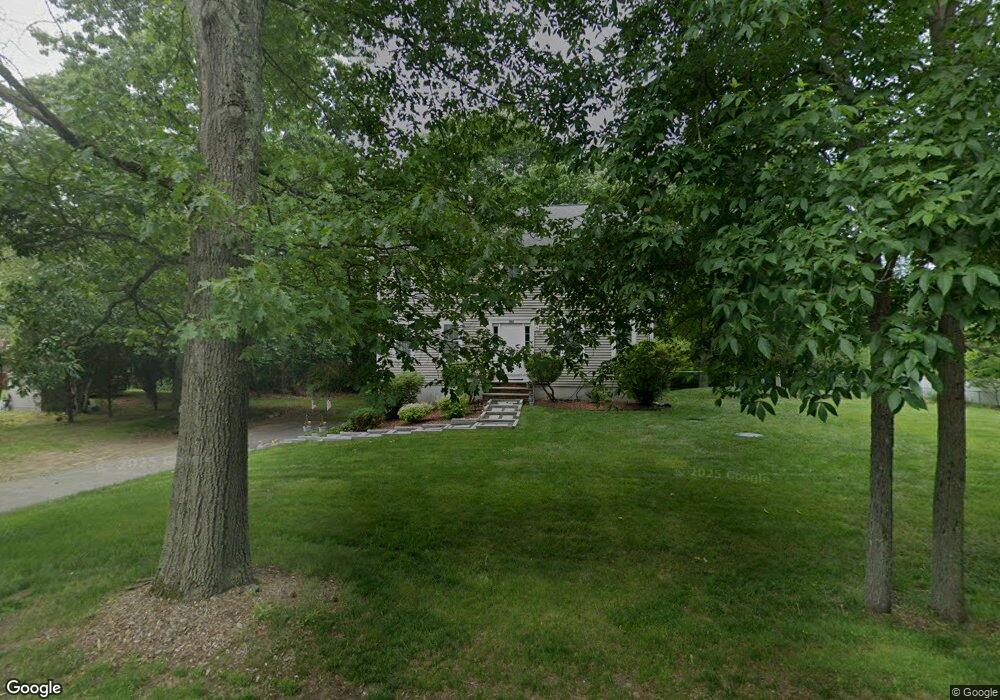
362 Walnut St West Bridgewater, MA 02379
Estimated Value: $640,353 - $822,000
3
Beds
3
Baths
1,872
Sq Ft
$399/Sq Ft
Est. Value
About This Home
This home is located at 362 Walnut St, West Bridgewater, MA 02379 and is currently estimated at $747,088, approximately $399 per square foot. 362 Walnut St is a home located in Plymouth County with nearby schools including Spring Street Elementary School, Howard Elementary School, and Rose L. MacDonald Elementary School.
Ownership History
Date
Name
Owned For
Owner Type
Purchase Details
Closed on
Apr 30, 2010
Sold by
Wright Dennis J and Wright Allison M
Bought by
Norym Rt and Fuller Myron F
Current Estimated Value
Home Financials for this Owner
Home Financials are based on the most recent Mortgage that was taken out on this home.
Original Mortgage
$262,500
Outstanding Balance
$175,425
Interest Rate
4.99%
Mortgage Type
Purchase Money Mortgage
Estimated Equity
$571,663
Purchase Details
Closed on
Dec 10, 2001
Sold by
Jad Nt and Donato James A
Bought by
Bissett Allison M and Wright Dennis J
Home Financials for this Owner
Home Financials are based on the most recent Mortgage that was taken out on this home.
Original Mortgage
$226,320
Interest Rate
6.67%
Mortgage Type
Purchase Money Mortgage
Create a Home Valuation Report for This Property
The Home Valuation Report is an in-depth analysis detailing your home's value as well as a comparison with similar homes in the area
Home Values in the Area
Average Home Value in this Area
Purchase History
| Date | Buyer | Sale Price | Title Company |
|---|---|---|---|
| Norym Rt | $350,000 | -- | |
| Bissett Allison M | $285,806 | -- |
Source: Public Records
Mortgage History
| Date | Status | Borrower | Loan Amount |
|---|---|---|---|
| Open | Norym Rt | $262,500 | |
| Previous Owner | Bissett Allison M | $275,500 | |
| Previous Owner | Bissett Allison M | $226,320 | |
| Previous Owner | Bissett Allison M | $42,435 |
Source: Public Records
Tax History Compared to Growth
Tax History
| Year | Tax Paid | Tax Assessment Tax Assessment Total Assessment is a certain percentage of the fair market value that is determined by local assessors to be the total taxable value of land and additions on the property. | Land | Improvement |
|---|---|---|---|---|
| 2025 | $6,980 | $510,600 | $225,700 | $284,900 |
| 2024 | $6,804 | $480,200 | $204,900 | $275,300 |
| 2023 | $6,471 | $421,000 | $177,900 | $243,100 |
| 2022 | $6,327 | $390,100 | $167,500 | $222,600 |
| 2021 | $4,508 | $369,200 | $167,500 | $201,700 |
| 2020 | $4,718 | $379,700 | $167,500 | $212,200 |
| 2019 | $6,138 | $371,300 | $167,500 | $203,800 |
| 2018 | $8,358 | $355,800 | $159,200 | $196,600 |
| 2017 | $5,929 | $334,400 | $144,700 | $189,700 |
| 2016 | $5,839 | $324,400 | $134,700 | $189,700 |
| 2015 | $5,644 | $316,900 | $134,700 | $182,200 |
| 2014 | $5,226 | $316,900 | $134,700 | $182,200 |
Source: Public Records
Map
Nearby Homes
- 362 Linwood St
- 24 Pine St
- 63 Pine St
- 66 Depot St
- 5 Nadias Way
- 34 Emory St
- 1036 Ash St
- 19 Progressive Ave
- 741 Washington St Unit 7
- 40 Bristol Dr
- 925 Ash St
- 165 Pine Street (23 Lili Way)
- 11 Shields Ave
- 4 County Ln
- 13 Welch Rd Unit 13
- 20 Church St
- 56 Cottage Grove Ave
- 782 Ash St
- 18 Edinboro Ave
- 32 Hampden Ave