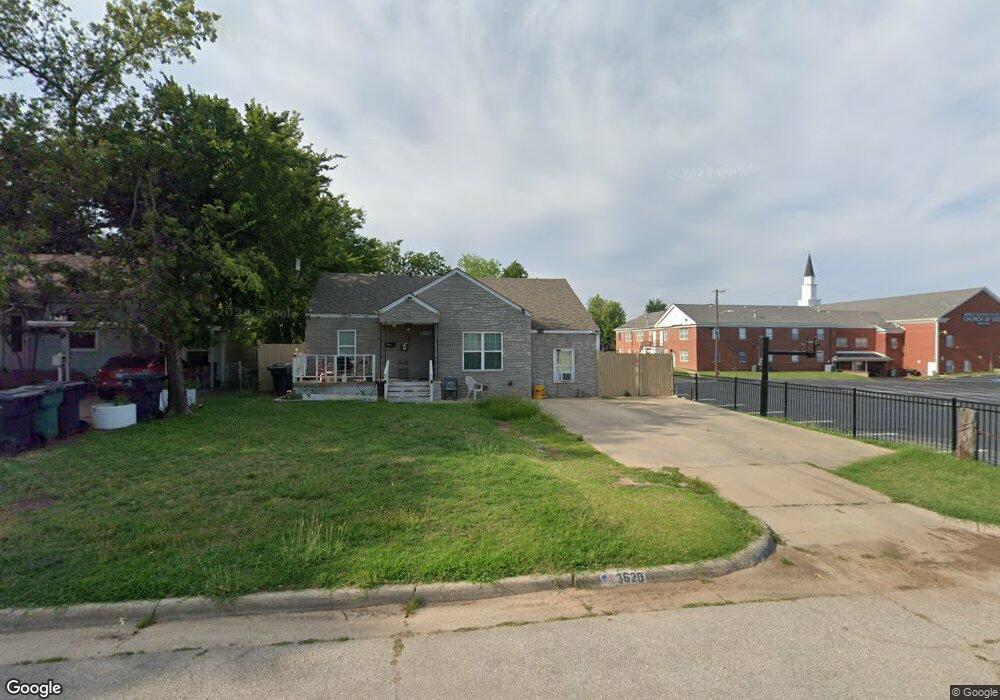
3620 NW 26th St Oklahoma City, OK 73107
Grand Portland NeighborhoodEstimated Value: $68,000 - $118,043
2
Beds
1
Bath
833
Sq Ft
$122/Sq Ft
Est. Value
About This Home
This home is located at 3620 NW 26th St, Oklahoma City, OK 73107 and is currently estimated at $101,761, approximately $122 per square foot. 3620 NW 26th St is a home located in Oklahoma County with nearby schools including Kaiser Elementary School, Taft Middle School, and Northwest Classen High School.
Ownership History
Date
Name
Owned For
Owner Type
Purchase Details
Closed on
Mar 12, 2018
Sold by
Msq Investments Inc
Bought by
Jamiluddin Muhammad and Jamil Farzana
Current Estimated Value
Purchase Details
Closed on
Feb 5, 2015
Sold by
Alam Sanzida and Homaun Kabir
Bought by
Msq Investments Inc
Purchase Details
Closed on
Oct 13, 2011
Sold by
Federal National Mortgage Association
Bought by
Alam Sanzida
Purchase Details
Closed on
Jun 16, 2011
Sold by
Ellison Steven and Chase Home Finance Llc
Bought by
Federal National Mortgage Association
Purchase Details
Closed on
Jan 15, 2003
Sold by
Rak Properties Inc
Bought by
Ellison Steven and Ellison Ana Maria
Purchase Details
Closed on
Jul 21, 1999
Sold by
Tuszynski Ruth Elaine
Bought by
Rak Properties Inc
Purchase Details
Closed on
Dec 10, 1998
Sold by
Cotner Joenita Dorkis and Forbes Dorkis
Bought by
Cotner Joenita and Tuszynski Ruth Elaine
Create a Home Valuation Report for This Property
The Home Valuation Report is an in-depth analysis detailing your home's value as well as a comparison with similar homes in the area
Home Values in the Area
Average Home Value in this Area
Purchase History
| Date | Buyer | Sale Price | Title Company |
|---|---|---|---|
| Jamiluddin Muhammad | $31,000 | None Available | |
| Msq Investments Inc | -- | American Eagle Title | |
| Msq Investments Inc | -- | None Available | |
| Alam Sanzida | $30,000 | Oklahoma Reo Closing & Title | |
| Federal National Mortgage Association | -- | None Available | |
| Ellison Steven | $43,500 | American Guaranty Title Co | |
| Rak Properties Inc | $12,000 | -- | |
| Cotner Joenita | -- | -- |
Source: Public Records
Tax History Compared to Growth
Tax History
| Year | Tax Paid | Tax Assessment Tax Assessment Total Assessment is a certain percentage of the fair market value that is determined by local assessors to be the total taxable value of land and additions on the property. | Land | Improvement |
|---|---|---|---|---|
| 2024 | $1,001 | $8,556 | $1,634 | $6,922 |
| 2023 | $1,001 | $8,149 | $1,710 | $6,439 |
| 2022 | $913 | $7,761 | $1,827 | $5,934 |
| 2021 | $870 | $7,392 | $2,108 | $5,284 |
| 2020 | $838 | $7,040 | $1,710 | $5,330 |
| 2019 | $720 | $6,048 | $1,580 | $4,468 |
| 2018 | $654 | $5,761 | $0 | $0 |
| 2017 | $622 | $5,486 | $1,706 | $3,780 |
| 2016 | $593 | $5,224 | $1,375 | $3,849 |
| 2015 | $509 | $4,447 | $1,372 | $3,075 |
| 2014 | -- | $4,235 | $1,375 | $2,860 |
Source: Public Records
Map
Nearby Homes
- 3709 NW 24th St
- 2804 NW 24th St
- 3737 NW 26th St
- 3815 NW 23rd St
- 3817 NW 29th St
- 3405 NW 22nd St
- 3316 NW 26th St
- 3847 NW 21st St
- 3437 NW 20th St
- 3941 NW 23rd St
- 3345 NW 20th St
- 4020 NW 23rd St
- 2807 N Lyon Blvd
- 3429 NW 19th St
- 2201 N Shawnee Ave
- 3205 Otterson Dr
- 3224 NW 24th St
- 3701 NW 18th St
- 3229 N Nesbitt Ave
- 3217 NW 22nd St
- 3616 NW 26th St
- 3612 NW 26th St
- 3621 NW 25th St
- 3617 NW 25th St
- 3608 NW 26th St
- 3613 NW 25th St
- 3621 NW 26th St
- 3617 NW 26th St
- 3604 NW 26th St
- 3609 NW 25th St
- 3613 NW 26th St
- 3605 NW 25th St
- 3600 NW 26th St
- 3605 NW 26th St
- 3601 NW 25th St
- 3601 NW 26th St
- 3620 NW 27th St
- 3616 NW 27th St
- 3620 NW 25th St
- 3624 NW 25th St