Estimated Value: $302,000 - $354,000
4
Beds
1
Bath
780
Sq Ft
$423/Sq Ft
Est. Value
About This Home
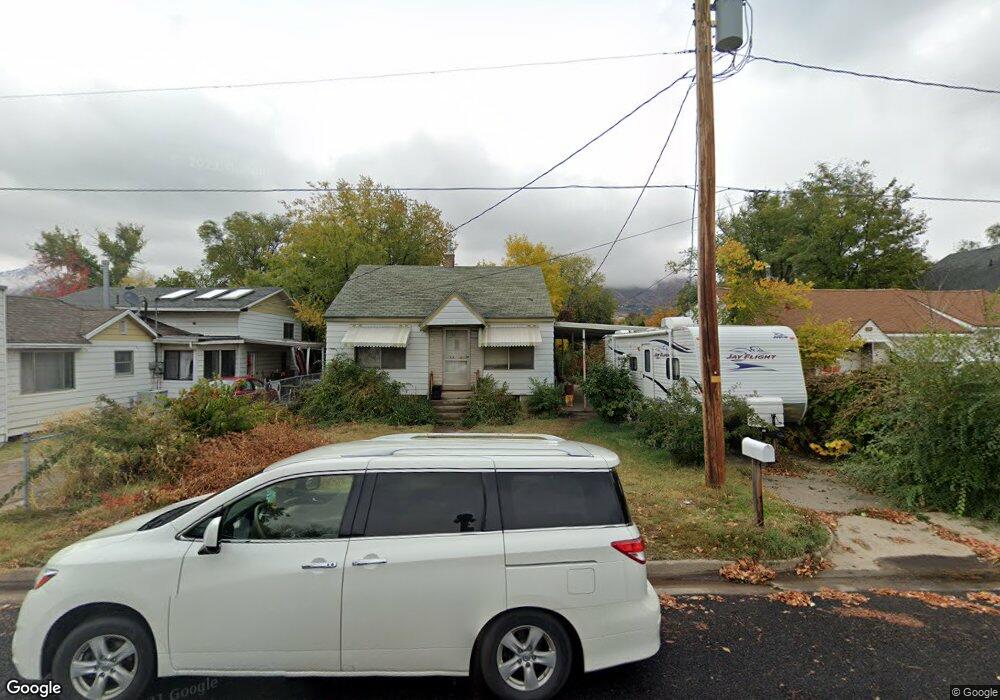
This home is located at 3620 Orchard Ave, Ogden, UT 84403 and is currently estimated at $329,960, approximately $423 per square foot. 3620 Orchard Ave is a home located in Weber County with nearby schools including Burch Creek School, South Ogden Junior High School, and Bonneville High School.
Ownership History
Date
Name
Owned For
Owner Type
Purchase Details
Closed on
Dec 26, 2017
Sold by
Farley Glory and Farley Timothy
Bought by
Farley Nicole M and Farley Lonnie R
Current Estimated Value
Home Financials for this Owner
Home Financials are based on the most recent Mortgage that was taken out on this home.
Original Mortgage
$90,000
Outstanding Balance
$75,872
Interest Rate
3.9%
Mortgage Type
New Conventional
Estimated Equity
$254,088
Purchase Details
Closed on
Nov 16, 2007
Sold by
Farley Timothy
Bought by
Farley Glory and Farley Timothy
Home Financials for this Owner
Home Financials are based on the most recent Mortgage that was taken out on this home.
Original Mortgage
$99,000
Interest Rate
6.35%
Mortgage Type
New Conventional
Purchase Details
Closed on
Oct 31, 2007
Sold by
Farley Tim
Bought by
Farley Timothy
Home Financials for this Owner
Home Financials are based on the most recent Mortgage that was taken out on this home.
Original Mortgage
$99,000
Interest Rate
6.35%
Mortgage Type
New Conventional
Purchase Details
Closed on
Jan 29, 2001
Sold by
Farley Charles Tinte
Bought by
Farley June H
Purchase Details
Closed on
Mar 3, 2000
Sold by
Farley June H
Bought by
Farley Charles Tinte and Farley June
Create a Home Valuation Report for This Property
The Home Valuation Report is an in-depth analysis detailing your home's value as well as a comparison with similar homes in the area
Home Values in the Area
Average Home Value in this Area
Purchase History
| Date | Buyer | Sale Price | Title Company |
|---|---|---|---|
| Farley Nicole M | -- | Stewart Title Ins Agcy | |
| Farley Glory | -- | Backman | |
| Farley Timothy | -- | None Available | |
| Farley June H | -- | -- | |
| Farley Charles Tinte | -- | -- |
Source: Public Records
Mortgage History
| Date | Status | Borrower | Loan Amount |
|---|---|---|---|
| Open | Farley Nicole M | $90,000 | |
| Closed | Farley Glory | $99,000 |
Source: Public Records
Tax History Compared to Growth
Tax History
| Year | Tax Paid | Tax Assessment Tax Assessment Total Assessment is a certain percentage of the fair market value that is determined by local assessors to be the total taxable value of land and additions on the property. | Land | Improvement |
|---|---|---|---|---|
| 2025 | $2,278 | $168,754 | $57,752 | $111,002 |
| 2024 | $2,177 | $164,999 | $57,751 | $107,248 |
| 2023 | $2,093 | $159,500 | $57,708 | $101,792 |
| 2022 | $1,900 | $147,950 | $49,504 | $98,446 |
| 2021 | $1,742 | $228,000 | $54,011 | $173,989 |
| 2020 | $1,555 | $187,000 | $44,998 | $142,002 |
| 2019 | $1,511 | $173,000 | $35,019 | $137,981 |
| 2018 | $1,372 | $147,000 | $35,019 | $111,981 |
| 2017 | $1,247 | $126,000 | $30,007 | $95,993 |
| 2016 | $1,111 | $61,198 | $16,526 | $44,672 |
| 2015 | $1,055 | $56,254 | $16,526 | $39,728 |
| 2014 | $844 | $41,669 | $16,526 | $25,143 |
Source: Public Records
Map
Nearby Homes
- 3530 Jefferson Ave
- 612 35th St
- 3596 Adams Ave
- 855 36th St
- 3567 Adams Ave
- 3555 Adams Ave
- 865 Maple St
- 3880 Raymond Ave
- 3874 Orchard Ave
- 3756 Ogden Ave
- 4615 S Monroe Blvd
- 3374 Porter Ave
- 3813 Grandview Dr
- 516 Diana St
- 522 34th St
- 3925 Nordin Ave
- 3365 Monroe Blvd
- 3312 Jefferson Ave
- 3853 Grandview Dr
- 3538 S Quincy Ave
- 3610 Orchard Ave
- 3644 Orchard Ave
- 3608 Orchard Ave
- 3646 Orchard Ave
- 3650 Orchard Ave
- 676 Maple St
- 3621 Orchard Ave Unit Downstairs
- 3621 S Orchard E
- 3621 Orchard Ave
- 3625 Orchard Ave
- 3615 Orchard Ave
- 677 36th St
- 3631 Orchard Ave
- 3647 Orchard Ave
- 3664 Orchard Ave
- 698 Maple St
- 675 Maple St
- 627 36th St
- 3655 Orchard Ave
- 625 36th St