Estimated Value: $493,000 - $851,000
--
Bed
3
Baths
4,244
Sq Ft
$160/Sq Ft
Est. Value
About This Home
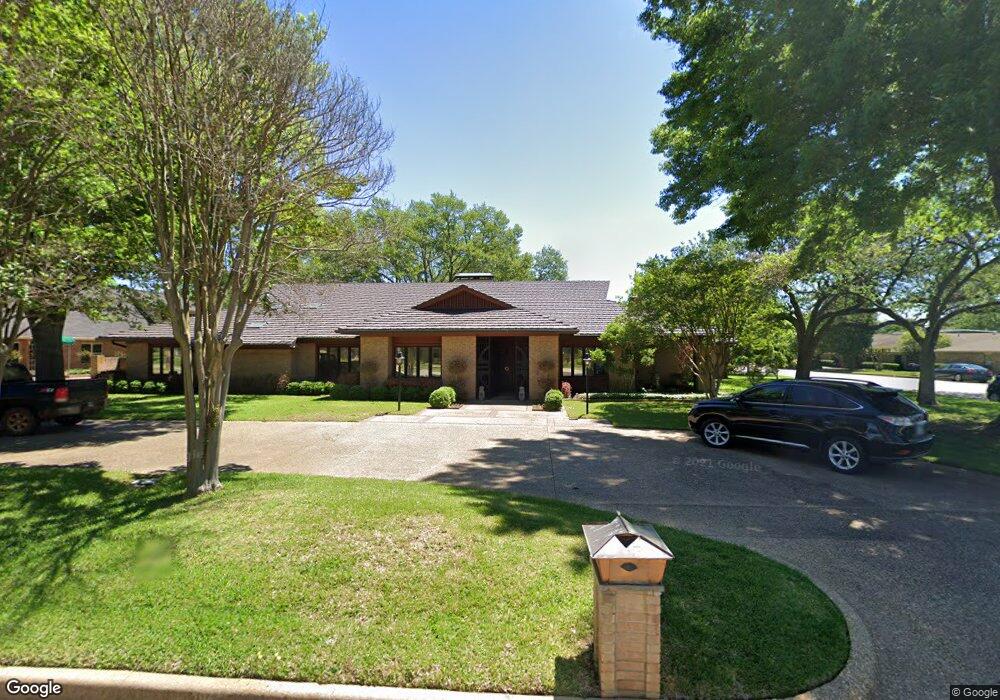
This home is located at 3620 Peggys Place, Tyler, TX 75701 and is currently estimated at $678,490, approximately $159 per square foot. 3620 Peggys Place is a home located in Smith County with nearby schools including Woods Elementary School, Hubbard Middle School, and Tyler Legacy High School.
Ownership History
Date
Name
Owned For
Owner Type
Purchase Details
Closed on
Sep 10, 2024
Sold by
Wharton Alan Derrick
Bought by
Wharton Audrey M
Current Estimated Value
Purchase Details
Closed on
Apr 7, 2017
Sold by
Morton Geraldine Hudson and Francis William D
Bought by
Wharton Alan Derrick and Wharton Audrey M
Home Financials for this Owner
Home Financials are based on the most recent Mortgage that was taken out on this home.
Original Mortgage
$416,000
Interest Rate
4.16%
Mortgage Type
New Conventional
Purchase Details
Closed on
Feb 22, 2012
Sold by
Morton Geraldine Hudson
Bought by
Morton Geraldine Hudson and Francis William D
Purchase Details
Closed on
Dec 2, 2005
Sold by
Ballard Shirley L
Bought by
Morton Glenn and Morton Geraldine H
Home Financials for this Owner
Home Financials are based on the most recent Mortgage that was taken out on this home.
Original Mortgage
$69,900
Interest Rate
6.06%
Mortgage Type
Purchase Money Mortgage
Create a Home Valuation Report for This Property
The Home Valuation Report is an in-depth analysis detailing your home's value as well as a comparison with similar homes in the area
Home Values in the Area
Average Home Value in this Area
Purchase History
| Date | Buyer | Sale Price | Title Company |
|---|---|---|---|
| Wharton Audrey M | -- | None Listed On Document | |
| Wharton Alan Derrick | -- | None Available | |
| Morton Geraldine Hudson | -- | None Available | |
| Morton Glenn | -- | None Available | |
| Morton Glenn | -- | None Available |
Source: Public Records
Mortgage History
| Date | Status | Borrower | Loan Amount |
|---|---|---|---|
| Previous Owner | Wharton Alan Derrick | $416,000 | |
| Previous Owner | Morton Glenn | $69,900 |
Source: Public Records
Tax History Compared to Growth
Tax History
| Year | Tax Paid | Tax Assessment Tax Assessment Total Assessment is a certain percentage of the fair market value that is determined by local assessors to be the total taxable value of land and additions on the property. | Land | Improvement |
|---|---|---|---|---|
| 2025 | $4,791 | $438,394 | $167,678 | $270,716 |
| 2024 | $4,791 | $339,904 | $69,188 | $270,716 |
| 2023 | $6,764 | $449,497 | $69,188 | $380,309 |
| 2022 | $10,371 | $538,957 | $69,188 | $469,769 |
| 2021 | $10,096 | $481,217 | $69,188 | $412,029 |
| 2020 | $10,109 | $472,436 | $67,900 | $404,536 |
| 2019 | $10,280 | $470,124 | $67,900 | $402,224 |
| 2018 | $11,204 | $515,150 | $67,900 | $447,250 |
| 2017 | $10,998 | $515,150 | $67,900 | $447,250 |
| 2016 | $10,574 | $495,299 | $67,900 | $427,399 |
| 2015 | $7,762 | $484,987 | $67,900 | $417,087 |
| 2014 | $7,762 | $479,472 | $67,900 | $411,572 |
Source: Public Records
Map
Nearby Homes
- 504 Woodland Hills Dr
- 3617 Jill Cir
- 410 Brighton Ct
- 604-606 Woodland Hills Dr
- 612 Rosemont Place II
- 701 Woodland Hills Dr
- 815 Woodland Hills Dr
- 3606 Glendale Dr
- 3308 Greenoak Place
- 3324 Teakwood Dr
- 505 Buckingham Place
- 509 Buckingham Place
- 3300 Old Bullard Rd
- 3500 Silverwood Dr
- 640 Beechwood Dr
- 403 Beechwood Dr
- 3518 Cloverdale Dr
- 3501 Silverwood Dr
- 3404 Silverwood Dr
- 429 Holiday Ln
- 3614 Peggys Place
- 3623 Jill Cir
- 512 512 Woodland Hills
- 510 Woodland Hills Dr
- 510 Woodland Hills Dr
- 512 Woodland Hills Dr
- 516 Woodland Hills Dr
- 506 Woodland Hills Dr
- 3619 Peggys Place
- 3608 Peggys Place
- 520 Woodland Hills Dr
- 3608 3608 Peggys Place
- 522 Woodland Hills Dr
- 3615 Peggys Place
- 3611 3611 Jill Cir
- 3611 Jill Cir
- 502 Woodland Hills Dr
- 502 502 Woodland Hills
- 601 Chase Dr
- 500 Woodland Hills Dr