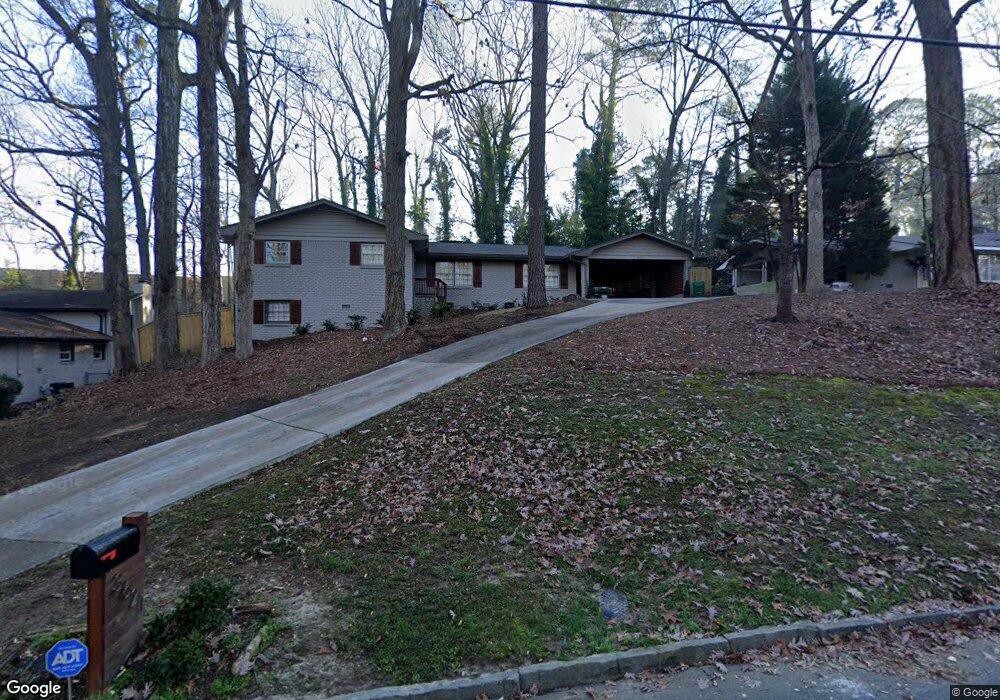
3621 Embry Cir Unit Un III Atlanta, GA 30341
Embry Hills NeighborhoodEstimated Value: $571,000 - $602,659
3
Beds
3
Baths
2,136
Sq Ft
$272/Sq Ft
Est. Value
About This Home
This home is located at 3621 Embry Cir Unit Un III, Atlanta, GA 30341 and is currently estimated at $580,665, approximately $271 per square foot. 3621 Embry Cir Unit Un III is a home located in DeKalb County with nearby schools including Henderson Mill Elementary School, Henderson Middle School, and Lakeside High School.
Ownership History
Date
Name
Owned For
Owner Type
Purchase Details
Closed on
Nov 7, 2019
Sold by
Dream Masters Investments Llc
Bought by
Greene Jamal I and Greene Latasha A
Current Estimated Value
Home Financials for this Owner
Home Financials are based on the most recent Mortgage that was taken out on this home.
Original Mortgage
$365,750
Outstanding Balance
$318,103
Interest Rate
3.5%
Estimated Equity
$262,562
Purchase Details
Closed on
Mar 15, 2018
Sold by
Mdw Development Inc
Bought by
Dream Masters Investments Llc
Purchase Details
Closed on
Sep 5, 2017
Sold by
Coolick Frederic R
Bought by
Broker Solutions Inc
Create a Home Valuation Report for This Property
The Home Valuation Report is an in-depth analysis detailing your home's value as well as a comparison with similar homes in the area
Home Values in the Area
Average Home Value in this Area
Purchase History
| Date | Buyer | Sale Price | Title Company |
|---|---|---|---|
| Greene Jamal I | $385,000 | -- | |
| Dream Masters Investments Llc | $245,000 | -- | |
| Mdw Development Inc | $223,300 | -- | |
| Broker Solutions Inc | $223,300 | -- |
Source: Public Records
Mortgage History
| Date | Status | Borrower | Loan Amount |
|---|---|---|---|
| Open | Greene Jamal I | $365,750 |
Source: Public Records
Tax History Compared to Growth
Tax History
| Year | Tax Paid | Tax Assessment Tax Assessment Total Assessment is a certain percentage of the fair market value that is determined by local assessors to be the total taxable value of land and additions on the property. | Land | Improvement |
|---|---|---|---|---|
| 2025 | $7,354 | $246,320 | $36,480 | $209,840 |
| 2024 | $7,453 | $238,160 | $36,480 | $201,680 |
| 2023 | $7,453 | $228,760 | $36,480 | $192,280 |
| 2022 | $6,729 | $205,720 | $36,480 | $169,240 |
| 2021 | $8,115 | $176,280 | $36,480 | $139,800 |
| 2020 | $7,137 | $154,000 | $34,440 | $119,560 |
| 2019 | $5,866 | $125,040 | $36,480 | $88,560 |
| 2018 | $4,576 | $117,400 | $50,160 | $67,240 |
| 2017 | $3,429 | $98,200 | $50,160 | $48,040 |
| 2016 | $3,637 | $109,560 | $50,160 | $59,400 |
| 2014 | $3,133 | $92,960 | $50,160 | $42,800 |
Source: Public Records
Map
Nearby Homes
- 3309 Chase Rd
- 3236 Henderson Mill Rd Unit 1
- 3236 Henderson Mill Rd Unit 5
- 3277 Chase Rd
- 3287 Alton Rd
- 3268 Henderson Mill Rd Unit C
- 3278 Embry Hills Dr Unit 2
- 3301 Henderson Mill Rd Unit 4
- 3301 Henderson Mill Rd Unit F1
- 3301 Henderson Mill Rd Unit Z1
- 3301 Henderson Mill Rd Unit D3
- 3301 Henderson Mill Rd Unit 3
- 3306 Northcrest Rd Unit A
- 3318 Stonecrest Ct
- 3320 Northcrest Rd Unit C
- 3440 Embry Cir
- 3312 Northcrest Rd Unit C
- 3463 Ashwood Ln Unit 3463
- 3479 Ashwood Ln
- 3288 Regalwoods Dr
- 3621 Embry Cir
- 3621 Embry Cir Unit 3
- 3629 Embry Cir
- 3603 Embry Cir
- 3628 Embry Cir
- 3610 Embry Cir
- 3639 Embry Cir
- 3618 Embry Cir
- 3602 Embry Cir
- 3347 David Rd
- 3647 Embry Cir
- 3337 David Rd
- 3589 Embry Cir
- 3360 Embry Hills Dr
- 3329 David Rd
- 3655 Embry Cir
- 3581 Embry Cir
- 3321 David Rd
- 3352 Embry Hills Dr
- 3666 Embry Cir