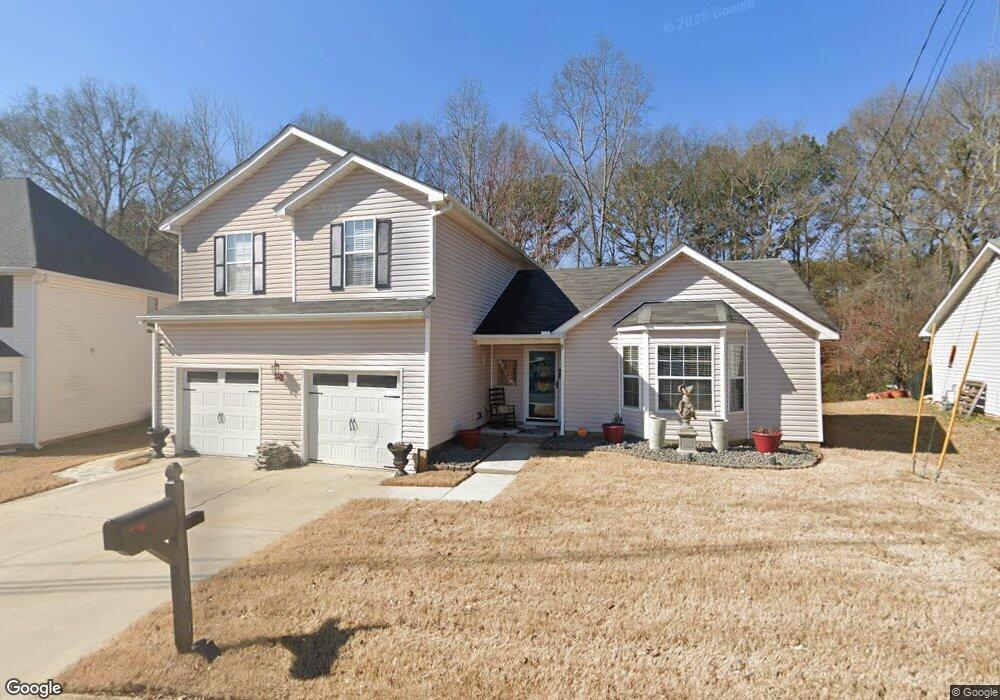
3621 Salem Glen Rd Lithonia, GA 30038
Estimated Value: $249,000 - $260,135
3
Beds
3
Baths
1,976
Sq Ft
$129/Sq Ft
Est. Value
About This Home
This home is located at 3621 Salem Glen Rd, Lithonia, GA 30038 and is currently estimated at $254,284, approximately $128 per square foot. 3621 Salem Glen Rd is a home located in DeKalb County with nearby schools including Flat Rock Elementary School, Salem Middle School, and Martin Luther King- Jr. High School.
Ownership History
Date
Name
Owned For
Owner Type
Purchase Details
Closed on
Oct 22, 2013
Sold by
Finley Lorena
Bought by
Pyles Brian Demetrius
Current Estimated Value
Purchase Details
Closed on
May 20, 2008
Sold by
Campbell Hartford
Bought by
Pyles Brian D and Finley Lorena
Home Financials for this Owner
Home Financials are based on the most recent Mortgage that was taken out on this home.
Original Mortgage
$122,084
Interest Rate
5.84%
Mortgage Type
FHA
Purchase Details
Closed on
Feb 7, 2006
Sold by
Matthews Andre L
Bought by
Campbell Hartford and Tanory Joseph
Purchase Details
Closed on
May 29, 1998
Sold by
Salem Hills Dev Co Inc
Bought by
Matthews Andre L
Home Financials for this Owner
Home Financials are based on the most recent Mortgage that was taken out on this home.
Original Mortgage
$101,400
Interest Rate
7.15%
Mortgage Type
FHA
Create a Home Valuation Report for This Property
The Home Valuation Report is an in-depth analysis detailing your home's value as well as a comparison with similar homes in the area
Home Values in the Area
Average Home Value in this Area
Purchase History
| Date | Buyer | Sale Price | Title Company |
|---|---|---|---|
| Pyles Brian Demetrius | -- | -- | |
| Pyles Brian D | $124,000 | -- | |
| Campbell Hartford | $101,460 | -- | |
| Matthews Andre L | $103,900 | -- |
Source: Public Records
Mortgage History
| Date | Status | Borrower | Loan Amount |
|---|---|---|---|
| Previous Owner | Pyles Brian D | $122,084 | |
| Previous Owner | Matthews Andre L | $101,400 |
Source: Public Records
Tax History Compared to Growth
Tax History
| Year | Tax Paid | Tax Assessment Tax Assessment Total Assessment is a certain percentage of the fair market value that is determined by local assessors to be the total taxable value of land and additions on the property. | Land | Improvement |
|---|---|---|---|---|
| 2025 | $3,044 | $106,920 | $20,000 | $86,920 |
| 2024 | $3,181 | $110,160 | $20,000 | $90,160 |
| 2023 | $3,181 | $94,560 | $16,000 | $78,560 |
| 2022 | $2,571 | $88,120 | $8,800 | $79,320 |
| 2021 | $2,180 | $69,960 | $8,800 | $61,160 |
| 2020 | $1,899 | $58,600 | $7,200 | $51,400 |
| 2019 | $1,678 | $50,880 | $7,200 | $43,680 |
| 2018 | $1,342 | $44,080 | $4,440 | $39,640 |
| 2017 | $1,345 | $39,880 | $4,440 | $35,440 |
| 2016 | $1,261 | $38,360 | $4,440 | $33,920 |
| 2014 | $1,150 | $35,160 | $4,440 | $30,720 |
Source: Public Records
Map
Nearby Homes
- 3615 Salem Glen Rd
- 3625 Salem Glen Rd
- 3611 Salem Glen Rd
- 3631 Salem Glen Rd
- 3618 Salem Glen Rd Unit 1
- 3626 Salem Glen Rd
- 3626 Salem Glen Rd Unit 3626
- 3607 Salem Glen Rd
- 3612 Salem Glen Rd Unit 1
- 3635 Salem Glen Rd
- 3632 Salem Glen Rd
- 3608 Salem Glen Rd Unit 1
- 3603 Salem Glen Rd
- 3641 Salem Glen Rd Unit 1A
- 3604 Salem Glen Rd Unit 1
- 3645 Salem Glen Rd
- 3642 Salem Glen Rd
- 3600 Salem Glen Rd
- 3595 Salem Glen Rd Unit 1A
- 3648 Salem Glen Rd Unit 1