3621 W Laredo St Chandler, AZ 85226
West Chandler NeighborhoodEstimated Value: $423,321 - $516,000
--
Bed
2
Baths
1,985
Sq Ft
$247/Sq Ft
Est. Value
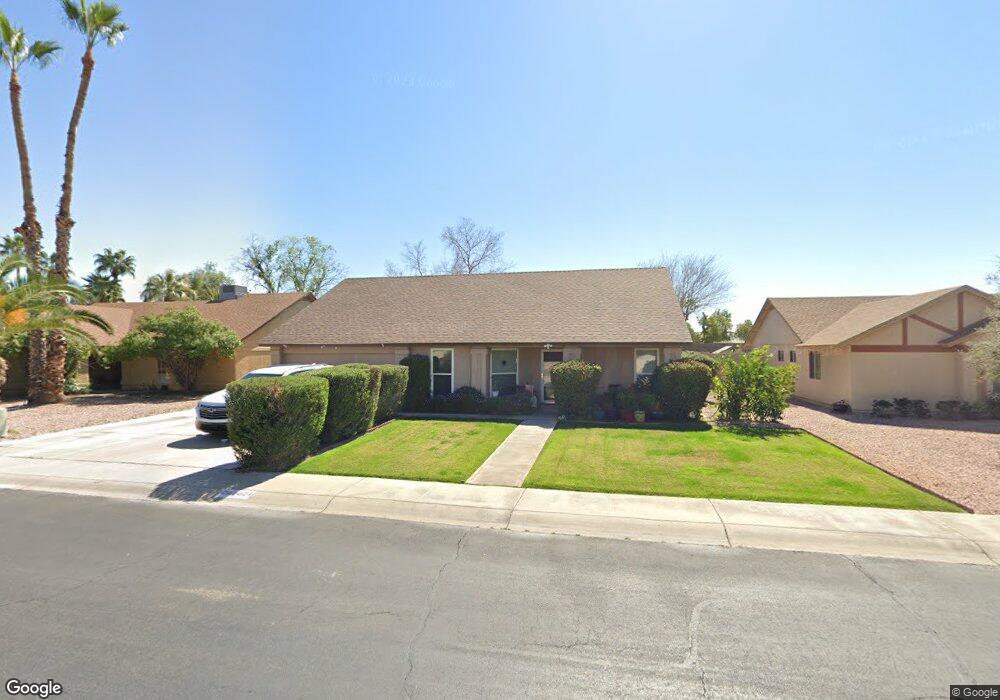
About This Home
This home is located at 3621 W Laredo St, Chandler, AZ 85226 and is currently estimated at $489,580, approximately $246 per square foot. 3621 W Laredo St is a home located in Maricopa County with nearby schools including Kyrene Traditional Academy, Kyrene Aprende Middle School, and Corona Del Sol High School.
Ownership History
Date
Name
Owned For
Owner Type
Purchase Details
Closed on
Dec 10, 2003
Sold by
Stcyr Doroth
Bought by
Scutt Michael and Scutt Terri Jo
Current Estimated Value
Purchase Details
Closed on
Aug 24, 1998
Sold by
Jacobs Terri Jo
Bought by
Stcyr Dorothy M
Purchase Details
Closed on
May 8, 1996
Sold by
Stcyr David and Stcyr Dorothy M
Bought by
Jacobs Terri Jo
Home Financials for this Owner
Home Financials are based on the most recent Mortgage that was taken out on this home.
Original Mortgage
$102,000
Interest Rate
7.68%
Mortgage Type
Seller Take Back
Purchase Details
Closed on
Jan 3, 1996
Sold by
Munoz Gregory D and Munoz Kelli C
Bought by
Stcyr David and Stcyr Dorothy M
Create a Home Valuation Report for This Property
The Home Valuation Report is an in-depth analysis detailing your home's value as well as a comparison with similar homes in the area
Home Values in the Area
Average Home Value in this Area
Purchase History
| Date | Buyer | Sale Price | Title Company |
|---|---|---|---|
| Scutt Michael | -- | -- | |
| Stcyr Dorothy M | -- | -- | |
| Jacobs Terri Jo | $102,000 | -- | |
| Stcyr David | $101,500 | -- |
Source: Public Records
Mortgage History
| Date | Status | Borrower | Loan Amount |
|---|---|---|---|
| Previous Owner | Jacobs Terri Jo | $102,000 |
Source: Public Records
Tax History Compared to Growth
Tax History
| Year | Tax Paid | Tax Assessment Tax Assessment Total Assessment is a certain percentage of the fair market value that is determined by local assessors to be the total taxable value of land and additions on the property. | Land | Improvement |
|---|---|---|---|---|
| 2025 | $1,908 | $23,950 | -- | -- |
| 2024 | $1,825 | $22,809 | -- | -- |
| 2023 | $1,825 | $36,780 | $7,350 | $29,430 |
| 2022 | $1,737 | $27,580 | $5,510 | $22,070 |
| 2021 | $1,832 | $26,110 | $5,220 | $20,890 |
| 2020 | $1,790 | $24,610 | $4,920 | $19,690 |
| 2019 | $1,737 | $22,920 | $4,580 | $18,340 |
| 2018 | $1,680 | $21,580 | $4,310 | $17,270 |
| 2017 | $1,601 | $20,380 | $4,070 | $16,310 |
| 2016 | $1,634 | $19,530 | $3,900 | $15,630 |
| 2015 | $1,508 | $18,270 | $3,650 | $14,620 |
Source: Public Records
Map
Nearby Homes
- 526 N Criss St
- 527 N Pepperwood Ct Unit 3
- 3382 W Monterey St
- 3513 W Carla Vista Dr
- 3833 W Ivanhoe St
- 3930 W Monterey St Unit 108
- 782 N Sicily Dr
- 3580 W Dublin St
- 3522 W Detroit St
- 802 N Butte Ave
- 4174 W Harrison St
- 991 N Florence Dr
- 3683 W Barcelona Dr
- 3947 W Roundabout Cir
- 390 N Enterprise Place Unit A6
- 2784 W Del Rio Place
- 3111 W Baylor Ln
- 3165 W Golden Ln
- 4554 W Detroit St
- 2725 W Flint St
- 3625 W Laredo St
- 3617 W Laredo St
- 530 N Criss St
- 3629 W Laredo St
- 3613 W Laredo St
- 527 N Los Feliz Dr
- 3624 W Laredo St
- 3628 W Laredo St
- 3620 W Laredo St
- 523 N Los Feliz Dr
- 3632 W Laredo St
- 531 N Criss St
- 3609 W Laredo St
- 3616 W Laredo St
- 3633 W Laredo St
- 522 N Criss St
- 526 N Los Feliz Dr
- 3627 W Del Rio St
- 519 N Los Feliz Dr Unit WOW!
- 519 N Los Feliz Dr