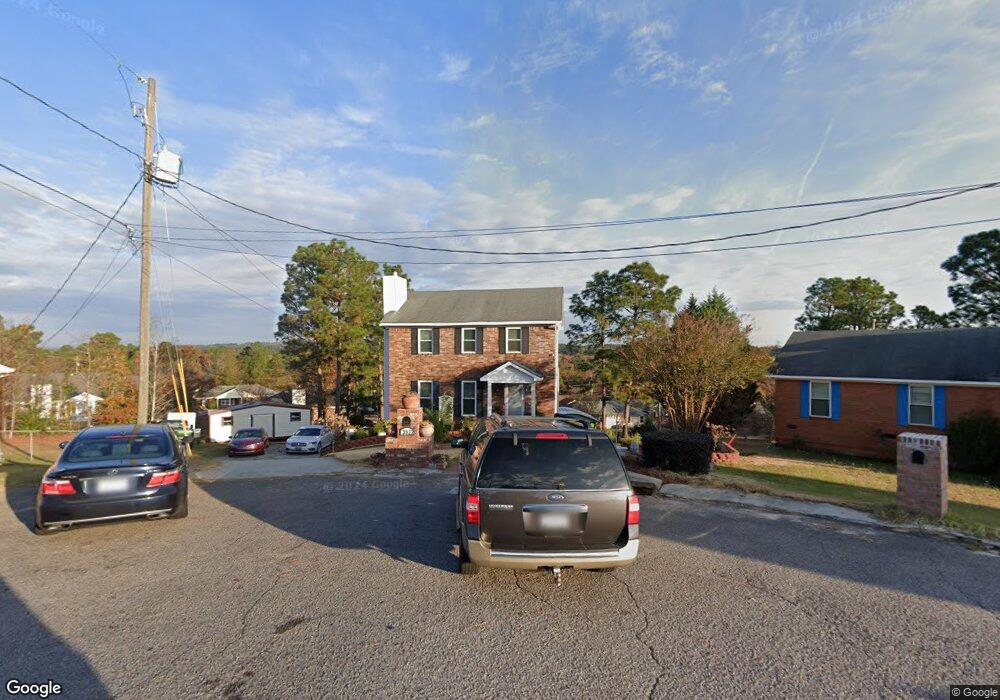
3622 Bitternut St Augusta, GA 30906
Pepperidge NeighborhoodEstimated Value: $190,349 - $223,000
3
Beds
2
Baths
1,624
Sq Ft
$124/Sq Ft
Est. Value
About This Home
This home is located at 3622 Bitternut St, Augusta, GA 30906 and is currently estimated at $200,587, approximately $123 per square foot. 3622 Bitternut St is a home located in Richmond County with nearby schools including Tobacco Road Elementary School, Richmond Hill K-8, and Johnson Magnet.
Ownership History
Date
Name
Owned For
Owner Type
Purchase Details
Closed on
Jan 13, 2020
Sold by
Shannon Melvin L
Bought by
Shannon Melvin L and Haley Shannon Cheryl
Current Estimated Value
Purchase Details
Closed on
Nov 23, 1992
Sold by
Nordahl Homes Inc
Bought by
Shannon Melvin L
Purchase Details
Closed on
Nov 18, 1992
Sold by
Nordahl Homes Inc
Bought by
Shannon Melvin L
Purchase Details
Closed on
Apr 10, 1992
Sold by
Nordahl & Company Inc
Bought by
Nordahl Homes Inc
Purchase Details
Closed on
Apr 1, 1992
Sold by
Nordahl & Company I
Bought by
Nordahl Homes Inc
Purchase Details
Closed on
Mar 8, 1991
Sold by
Chavous J Hobson
Bought by
Nordahl & Co Inc
Purchase Details
Closed on
Sep 27, 1990
Sold by
Chavous Chavous J and Chavous Hobson
Bought by
Chavous Chavous J and Chavous Hobson
Purchase Details
Closed on
Jul 13, 1990
Sold by
Chavous J Hobson
Bought by
Nordahl & Co Inc
Purchase Details
Closed on
Mar 15, 1990
Sold by
Griffis Albert
Bought by
Chavous J Hobson
Create a Home Valuation Report for This Property
The Home Valuation Report is an in-depth analysis detailing your home's value as well as a comparison with similar homes in the area
Home Values in the Area
Average Home Value in this Area
Purchase History
| Date | Buyer | Sale Price | Title Company |
|---|---|---|---|
| Shannon Melvin L | -- | -- | |
| Shannon Melvin L | -- | -- | |
| Shannon Melvin L | $84,900 | -- | |
| Nordahl Homes Inc | -- | -- | |
| Nordahl Homes Inc | -- | -- | |
| Nordahl & Co Inc | -- | -- | |
| Chavous Chavous J | -- | -- | |
| Nordahl & Co Inc | $421,000 | -- | |
| Chavous J Hobson | $86,000 | -- |
Source: Public Records
Tax History
| Year | Tax Paid | Tax Assessment Tax Assessment Total Assessment is a certain percentage of the fair market value that is determined by local assessors to be the total taxable value of land and additions on the property. | Land | Improvement |
|---|---|---|---|---|
| 2025 | $2,235 | $65,684 | $7,380 | $58,304 |
| 2024 | $2,235 | $74,736 | $7,380 | $67,356 |
| 2023 | $2,402 | $61,164 | $7,380 | $53,784 |
| 2022 | $2,243 | $65,978 | $7,380 | $58,598 |
| 2021 | $1,617 | $39,756 | $7,380 | $32,376 |
| 2020 | $1,594 | $39,756 | $7,380 | $32,376 |
| 2019 | $1,682 | $39,756 | $7,380 | $32,376 |
| 2018 | $1,693 | $39,756 | $7,380 | $32,376 |
| 2017 | $1,622 | $39,756 | $7,380 | $32,376 |
| 2016 | $1,623 | $39,756 | $7,380 | $32,376 |
| 2015 | $1,684 | $39,756 | $7,380 | $32,376 |
| 2014 | $1,636 | $39,756 | $7,380 | $32,376 |
Source: Public Records
Map
Nearby Homes
- 3545 Monte Carlo Dr
- 3622 Seelye Dr
- 2104 Oakleaf Way
- 2120 Faircrest Ave
- 2113 Chadwick Rd
- 4349 White Pines Ct
- 3388 Thames Place
- 3606 Greiner Dr
- 3434 Thames Place
- 3611 Kentwood Dr Unit 1
- 3758 Bansbury Place
- 2115 Ashley Dr
- 2101 Rosier Rd
- 3708 Lexington Dr
- 3412 Sutton Place
- 2152 Rosier Rd
- 3346 Thames Place
- 2165 Rosier Rd
- 3507 Custis Ct
- 1922 Elizabeth Dr
- 3620 Bitternut St
- 2172 Ramblewood Dr
- 2174 Ramblewood Dr
- 3615 Bitternut St
- 2170 Ramblewood Dr
- 2176 Ramblewood Dr
- 3618 Bitternut St
- 2168 Ramblewood Dr
- 3613 Bitternut St
- 2178 Ramblewood Dr
- 3559 Monte Carlo Dr
- 3557 Monte Carlo Dr
- 3616 Bitternut St
- 3611 Bitternut St
- 3561 Monte Carlo Dr
- 2177 Ramblewood Dr
- 2179 Ramblewood Dr
- 3555 Monte Carlo Dr
- 3507 Hilltop Dr
- 2181 Ramblewood Dr
Your Personal Tour Guide
Ask me questions while you tour the home.