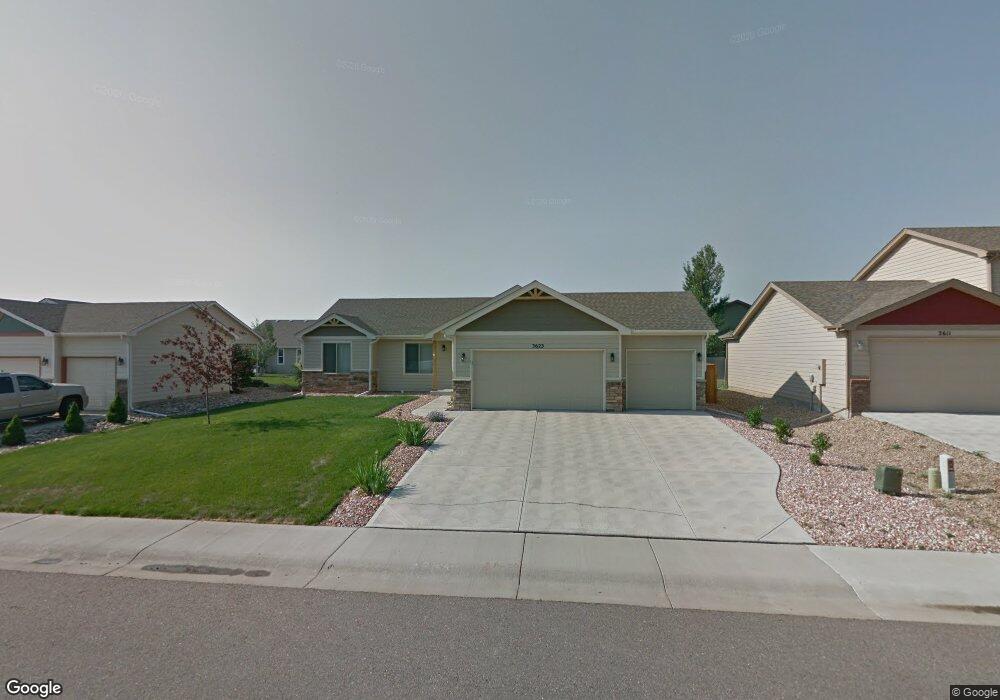
3623 Hyacinth St Wellington, CO 80549
Estimated Value: $452,000 - $474,000
3
Beds
2
Baths
1,470
Sq Ft
$314/Sq Ft
Est. Value
About This Home
This home is located at 3623 Hyacinth St, Wellington, CO 80549 and is currently estimated at $462,205, approximately $314 per square foot. 3623 Hyacinth St is a home located in Larimer County with nearby schools including Rice Elementary School and Wellington Middle School.
Ownership History
Date
Name
Owned For
Owner Type
Purchase Details
Closed on
Apr 27, 2012
Sold by
Hall Cathy and Hall Edward
Bought by
Grabowski John L and Grabowski Karen S
Current Estimated Value
Home Financials for this Owner
Home Financials are based on the most recent Mortgage that was taken out on this home.
Original Mortgage
$115,000
Outstanding Balance
$80,458
Interest Rate
4.11%
Mortgage Type
New Conventional
Estimated Equity
$381,747
Purchase Details
Closed on
Mar 26, 2010
Sold by
Hall Cathy L and Hall Edward B
Bought by
Hall Cathy and Hall Edward
Home Financials for this Owner
Home Financials are based on the most recent Mortgage that was taken out on this home.
Original Mortgage
$163,795
Interest Rate
5%
Mortgage Type
New Conventional
Purchase Details
Closed on
Jul 7, 2008
Sold by
Sage Homes Llc
Bought by
Hall Cathy L and Hall Edward B
Home Financials for this Owner
Home Financials are based on the most recent Mortgage that was taken out on this home.
Original Mortgage
$164,400
Interest Rate
5.99%
Mortgage Type
Purchase Money Mortgage
Create a Home Valuation Report for This Property
The Home Valuation Report is an in-depth analysis detailing your home's value as well as a comparison with similar homes in the area
Home Values in the Area
Average Home Value in this Area
Purchase History
| Date | Buyer | Sale Price | Title Company |
|---|---|---|---|
| Grabowski John L | $195,000 | Land Title Guarantee Company | |
| Hall Cathy | -- | Land Title Guarantee Company | |
| Hall Cathy L | $205,500 | Land Title Guarantee Company |
Source: Public Records
Mortgage History
| Date | Status | Borrower | Loan Amount |
|---|---|---|---|
| Open | Grabowski John L | $115,000 | |
| Previous Owner | Hall Cathy | $163,795 | |
| Previous Owner | Hall Cathy L | $164,400 |
Source: Public Records
Tax History Compared to Growth
Tax History
| Year | Tax Paid | Tax Assessment Tax Assessment Total Assessment is a certain percentage of the fair market value that is determined by local assessors to be the total taxable value of land and additions on the property. | Land | Improvement |
|---|---|---|---|---|
| 2025 | $3,090 | $31,664 | $9,038 | $22,626 |
| 2024 | $2,964 | $31,664 | $9,038 | $22,626 |
| 2022 | $2,557 | $23,304 | $6,429 | $16,875 |
| 2021 | $2,592 | $23,974 | $6,614 | $17,360 |
| 2020 | $2,494 | $22,902 | $6,657 | $16,245 |
| 2019 | $2,504 | $22,902 | $6,657 | $16,245 |
| 2018 | $2,248 | $21,060 | $3,679 | $17,381 |
| 2017 | $2,243 | $21,060 | $3,679 | $17,381 |
| 2016 | $2,011 | $20,003 | $2,149 | $17,854 |
| 2015 | $1,979 | $20,000 | $2,150 | $17,850 |
| 2014 | $1,642 | $16,420 | $1,590 | $14,830 |
Source: Public Records
Map
Nearby Homes
- 6635 Cranesbill St
- 3761 Mount Flora St
- HENNESSY Plan at Mountain View Ranch
- HARMONY Plan at Mountain View Ranch
- PENDLETON Plan at Mountain View Ranch
- BRIDGEPORT Plan at Mountain View Ranch
- HOLCOMBE Plan at Mountain View Ranch
- 6548 Coralbell St
- 6477 Coralbell St
- 3993 Mount Hope St
- 3713 Catmint St
- 6824 Hayfield St
- 6345 Globeflower St
- 4125 Crittenton Ln Unit 2
- 7148 Mount Nimbus St
- 4101 Crittenton Ln Unit 106U
- 4101 Crittenton Ln Unit 102
- 6997 Feather Reed Dr
- 7124 Ryegrass Dr
- 3603 Ronald Reagan Ave
- 3611 Hyacinth St
- 3634 Hyacinth St
- 3635 Hyacinth St
- 3610 Wine Cup St
- 3656 Hyacinth St
- 3657 Hyacinth St
- 3622 Wine Cup St
- 3622 Hyacinth St
- 3634 Wine Cup St
- 3610 Hyacinth St
- 6657 Cranesbill St
- 3678 Hyacinth St
- 3608 Hyacinth St
- 3679 Hyacinth St
- 6691 Cranesbill St
- 3678 Wine Cup St
- 3623 Wine Cup St
- 3635 Wine Cup St
- 3611 Wine Cup St
- 3690 Hyacinth St