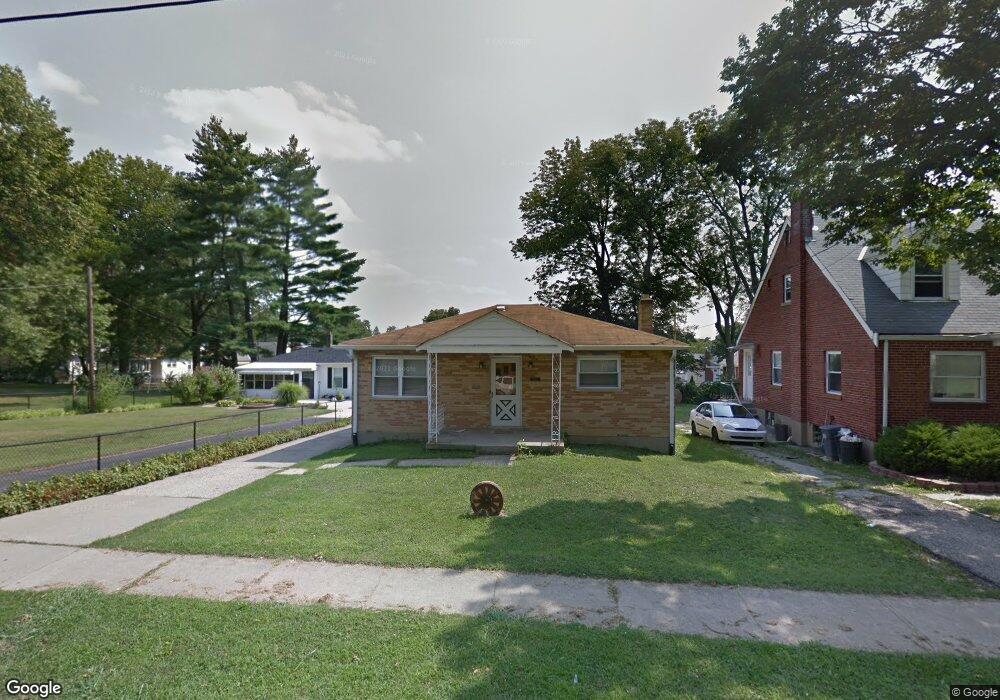
3623 Puhlman Ave Cincinnati, OH 45211
Estimated Value: $89,000 - $152,066
2
Beds
1
Bath
924
Sq Ft
$133/Sq Ft
Est. Value
About This Home
This home is located at 3623 Puhlman Ave, Cincinnati, OH 45211 and is currently estimated at $122,517, approximately $132 per square foot. 3623 Puhlman Ave is a home located in Hamilton County with nearby schools including Cheviot Elementary School, Western Hills High School, and Gilbert A. Dater High School.
Ownership History
Date
Name
Owned For
Owner Type
Purchase Details
Closed on
Oct 5, 2004
Sold by
Hud
Bought by
Gehrum Bryan E and Gehrum Angie L
Current Estimated Value
Home Financials for this Owner
Home Financials are based on the most recent Mortgage that was taken out on this home.
Original Mortgage
$49,600
Interest Rate
5.93%
Mortgage Type
Fannie Mae Freddie Mac
Purchase Details
Closed on
Jul 1, 2004
Sold by
Wells Fargo Home Mortgage Inc
Bought by
Hud
Purchase Details
Closed on
Apr 1, 2004
Sold by
Shell Chrissy
Bought by
Wells Fargo Home Mortgage Inc
Purchase Details
Closed on
Jun 28, 2001
Sold by
Anders Dorothy
Bought by
Shell Chrissy
Home Financials for this Owner
Home Financials are based on the most recent Mortgage that was taken out on this home.
Original Mortgage
$80,733
Interest Rate
7.27%
Mortgage Type
FHA
Create a Home Valuation Report for This Property
The Home Valuation Report is an in-depth analysis detailing your home's value as well as a comparison with similar homes in the area
Home Values in the Area
Average Home Value in this Area
Purchase History
| Date | Buyer | Sale Price | Title Company |
|---|---|---|---|
| Gehrum Bryan E | $62,000 | Lakeside Title & Escrow Agen | |
| Hud | -- | -- | |
| Wells Fargo Home Mortgage Inc | $67,000 | -- | |
| Shell Chrissy | $82,000 | -- |
Source: Public Records
Mortgage History
| Date | Status | Borrower | Loan Amount |
|---|---|---|---|
| Previous Owner | Gehrum Bryan E | $49,600 | |
| Previous Owner | Shell Chrissy | $80,733 |
Source: Public Records
Tax History Compared to Growth
Tax History
| Year | Tax Paid | Tax Assessment Tax Assessment Total Assessment is a certain percentage of the fair market value that is determined by local assessors to be the total taxable value of land and additions on the property. | Land | Improvement |
|---|---|---|---|---|
| 2024 | $2,184 | $34,126 | $7,417 | $26,709 |
| 2023 | $2,187 | $34,126 | $7,417 | $26,709 |
| 2022 | $2,213 | $29,936 | $6,419 | $23,517 |
| 2021 | $2,202 | $29,936 | $6,419 | $23,517 |
| 2020 | $2,179 | $29,936 | $6,419 | $23,517 |
| 2019 | $2,154 | $26,492 | $5,681 | $20,811 |
| 2018 | $2,156 | $26,492 | $5,681 | $20,811 |
| 2017 | $2,088 | $26,492 | $5,681 | $20,811 |
| 2016 | $2,132 | $26,268 | $5,852 | $20,416 |
| 2015 | $1,920 | $26,268 | $5,852 | $20,416 |
| 2014 | $1,877 | $26,268 | $5,852 | $20,416 |
| 2013 | $1,848 | $25,502 | $5,681 | $19,821 |
Source: Public Records
Map
Nearby Homes
- 3982 Davis Ave
- 3594 Homelawn Ave
- 3608 Westwood Northern Blvd
- 4104 Trevor Ave
- 3640 Westwood Northern Blvd
- 4117 N Bend Rd Unit 8
- 4117 N Bend Rd
- 4001 Lovell Ave
- 4038 Washington Ave
- 3325 Camvic Terrace
- 3997 Washington Ave
- 3935 Lovell Ave
- 0 Westwood Northern Blvd Unit 1851736
- 3502 Woodbine Ave
- 4031 Homelawn Ave
- 3774 Ridgewood Ave
- 3853 Delmar Ave
- 3827 Boudinot Ave
- 3842 Delmar Ave
- 3846 Davis Ave
- 3621 Puhlman Ave
- 3625 Puhlman Ave
- 3627 Puhlman Ave
- 3610 Homelawn Ave
- 3608 Homelawn Ave
- 3617 Puhlman Ave
- 3612 Homelawn Ave
- 3629 Puhlman Ave
- 3622 Puhlman Ave
- 3620 Puhlman Ave
- 3624 Puhlman Ave
- 3606 Homelawn Ave
- 3614 Homelawn Ave
- 3618 Puhlman Ave
- 3615 Puhlman Ave
- 3604 Homelawn Ave
- 3626 Puhlman Ave
- 3616 Homelawn Ave
- 3631 Puhlman Ave
- 3628 Puhlman Ave