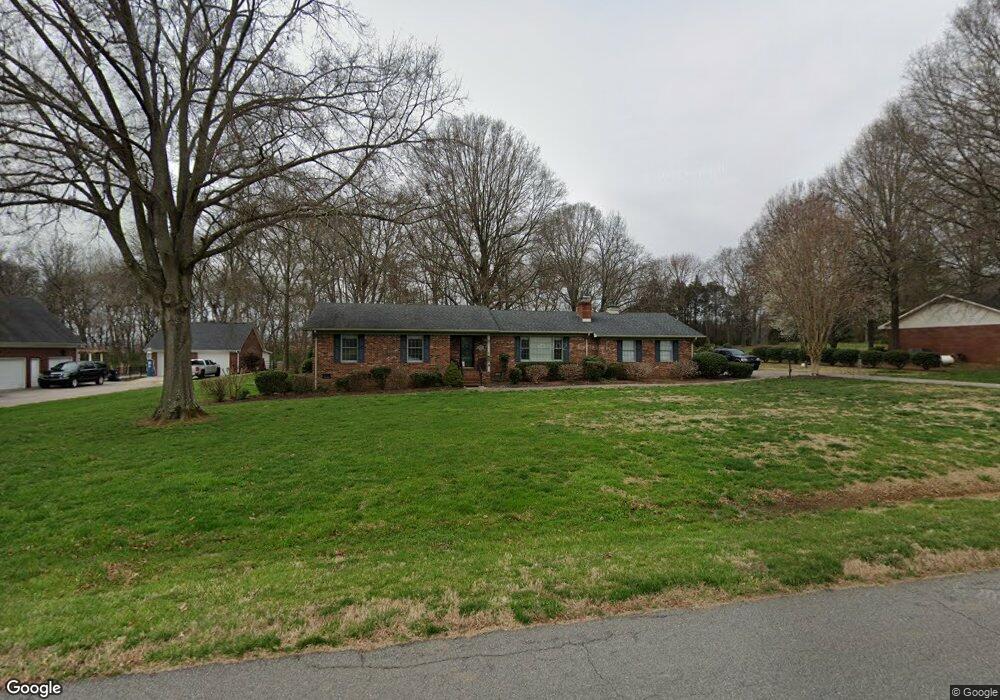
3624 Glen Haven Dr SW Concord, NC 28027
Estimated Value: $452,068 - $480,000
3
Beds
2
Baths
1,840
Sq Ft
$254/Sq Ft
Est. Value
About This Home
This home is located at 3624 Glen Haven Dr SW, Concord, NC 28027 and is currently estimated at $467,267, approximately $253 per square foot. 3624 Glen Haven Dr SW is a home located in Cabarrus County with nearby schools including Pitts School Road Elementary School, Roberta Road Middle School, and Jay M. Robinson High School.
Ownership History
Date
Name
Owned For
Owner Type
Purchase Details
Closed on
Mar 23, 2016
Sold by
Underwood Margie P
Bought by
Kelley Danne Brian and Kelley Sonja Elizabeth
Current Estimated Value
Home Financials for this Owner
Home Financials are based on the most recent Mortgage that was taken out on this home.
Original Mortgage
$226,773
Outstanding Balance
$179,490
Interest Rate
3.65%
Mortgage Type
VA
Estimated Equity
$287,777
Purchase Details
Closed on
May 26, 2005
Sold by
Howell Russell W and Howell Cheryl M
Bought by
Underwood Robert E and Underwood Margie P
Purchase Details
Closed on
Apr 1, 1992
Bought by
Howell Russell W and Howell Wife
Purchase Details
Closed on
Dec 1, 1976
Create a Home Valuation Report for This Property
The Home Valuation Report is an in-depth analysis detailing your home's value as well as a comparison with similar homes in the area
Home Values in the Area
Average Home Value in this Area
Purchase History
| Date | Buyer | Sale Price | Title Company |
|---|---|---|---|
| Kelley Danne Brian | $222,000 | None Available | |
| Underwood Robert E | $185,000 | -- | |
| Howell Russell W | $123,000 | -- | |
| -- | $3,500 | -- |
Source: Public Records
Mortgage History
| Date | Status | Borrower | Loan Amount |
|---|---|---|---|
| Open | Kelley Danne Brian | $226,773 |
Source: Public Records
Tax History Compared to Growth
Tax History
| Year | Tax Paid | Tax Assessment Tax Assessment Total Assessment is a certain percentage of the fair market value that is determined by local assessors to be the total taxable value of land and additions on the property. | Land | Improvement |
|---|---|---|---|---|
| 2025 | $3,945 | $396,120 | $90,000 | $306,120 |
| 2024 | $3,945 | $396,120 | $90,000 | $306,120 |
| 2023 | $2,820 | $231,170 | $60,000 | $171,170 |
| 2022 | $2,820 | $231,170 | $60,000 | $171,170 |
| 2021 | $2,820 | $231,170 | $60,000 | $171,170 |
| 2020 | $2,820 | $231,170 | $60,000 | $171,170 |
| 2019 | $2,374 | $194,560 | $55,000 | $139,560 |
| 2018 | $2,335 | $194,560 | $55,000 | $139,560 |
| 2017 | $2,296 | $194,560 | $55,000 | $139,560 |
| 2016 | $1,362 | $186,130 | $55,000 | $131,130 |
| 2015 | $2,196 | $186,130 | $55,000 | $131,130 |
| 2014 | $2,196 | $186,130 | $55,000 | $131,130 |
Source: Public Records
Map
Nearby Homes
- 287 Halton Crossing Dr SW
- 193 Halton Crossing Dr SW
- 4370 Coddle Creek Dr
- 4112 Alexis Ct SW
- 4114 Carolina Pointe Ct SW
- 4178 Morris Burn Dr SW
- 3811 Bent Creek Dr SW
- 3807 Bent Creek Dr SW
- 706 King Fredrick Ln SW
- 4333 Glen Eagles Ln SW
- 5899 Misty Forest Place NW
- 5851 Misty Forest Place NW
- 3141 Yates Mill Dr SW
- 159 Pitts School Rd NW
- 4835 Chesney St NW
- 4831 Turnridge Ct NW
- 4760 Lauren Glen St NW
- 4827 Chesney St NW
- 4349 Roberta Rd
- 3455 Roberta Rd
- 3616 Glen Haven Dr SW
- 3630 Glen Haven Dr SW
- 3612 Glen Haven Dr SW
- 3636 Glen Haven Dr SW
- 3621 Glen Haven Dr SW
- 3633 Glen Haven Dr SW
- 3615 Glen Haven Dr SW
- 3604 Glen Haven Dr SW
- 3640 Glen Haven Dr SW
- 3639 Glen Haven Dr SW
- 3609 Glen Haven Dr SW
- 4611 Alamo Ct SW
- 201 Pitts School Rd SW
- 4615 Wrangler Dr SW
- 4616 Alamo Ct SW
- 241 Pitts School Rd SW
- 9/10LT Shenandoah Dr SW
- 4614 Ranchway Dr SW
- 3590 Glen Haven Dr SW
- 3648 Glen Haven Dr SW Unit 71