
Seller's Agent in 2014
Ronald Duff
RE/MAX Professionals
(217) 652-6025
36 Total Sales

Estimated Value: $114,491 - $142,000
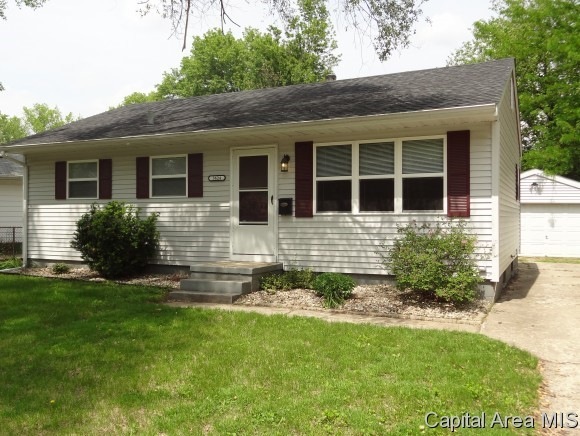
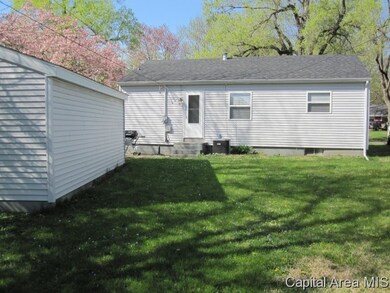
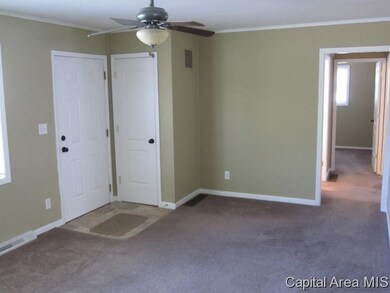
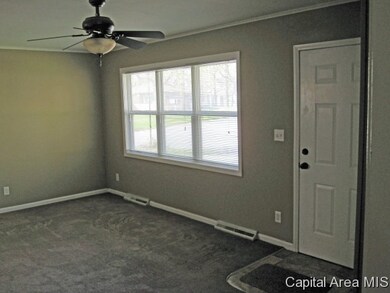
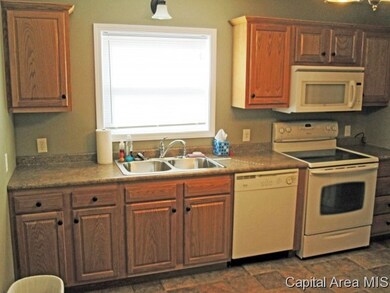
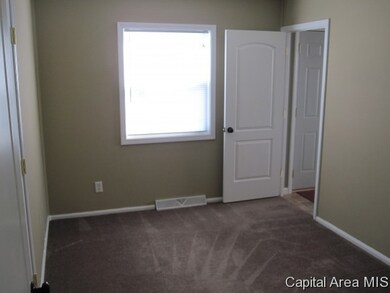
Totally updated 3 bedroom home is move-in ready! Newly renovated kitchen, including drywall, oak cabinetry, countertops, fixtures & flooring. Newer bathroom & all new doors, trim, windows, roof & siding. SQFT believed accurate but not warranted. This home is a pleasure to show!
Last Agent to Sell the Property
RE/MAX Professionals License #471001747 Listed on: 05/22/2014
| Date | Buyer | Sale Price | Title Company |
|---|---|---|---|
| -- | $74,900 | -- | |
| -- | $46,000 | -- | |
| -- | $78,700 | -- | |
| -- | -- | -- | |
| -- | $68,000 | -- |
| Date | Event | Price | List to Sale | Price per Sq Ft |
|---|---|---|---|---|
| 12/24/2014 12/24/14 | Sold | $74,900 | -19.4% | $84 / Sq Ft |
| 11/11/2014 11/11/14 | Pending | -- | -- | -- |
| 05/22/2014 05/22/14 | For Sale | $92,900 | -- | $104 / Sq Ft |
| Year | Tax Paid | Tax Assessment Tax Assessment Total Assessment is a certain percentage of the fair market value that is determined by local assessors to be the total taxable value of land and additions on the property. | Land | Improvement |
|---|---|---|---|---|
| 2024 | $2,090 | $33,268 | $8,946 | $24,322 |
| 2023 | $2,021 | $30,803 | $8,283 | $22,520 |
| 2022 | $1,913 | $29,151 | $7,839 | $21,312 |
| 2021 | $1,828 | $28,009 | $7,532 | $20,477 |
| 2020 | $1,758 | $27,704 | $7,450 | $20,254 |
| 2019 | $1,686 | $27,220 | $7,320 | $19,900 |
| 2018 | $1,627 | $27,104 | $7,289 | $19,815 |
| 2017 | $1,581 | $26,688 | $7,177 | $19,511 |
| 2016 | $1,521 | $25,999 | $6,992 | $19,007 |
| 2015 | $1,519 | $25,412 | $6,834 | $18,578 |
| 2014 | $1,908 | $25,200 | $6,777 | $18,423 |
| 2013 | $1,879 | $25,470 | $6,850 | $18,620 |
Seller's Agent in 2014
Ronald Duff
RE/MAX Professionals
(217) 652-6025
36 Total Sales
Buyer's Agent in 2014
SHELBA PALMER
Welcome Home Realty IL. Inc
(217) 416-9312
43 Total Sales
Source: RMLS Alliance
MLS Number: RMACA142644
APN: 22-14.0-254-009
Disclaimer: Certain information contained herein is derived from information provided by parties other than Homes.com. All information provided is deemed reliable, but is not guaranteed to be accurate and should be independently verified.
![]() Based on information submitted to the MLS GRID. All data is obtained from various sources and may not have been verified by broker or MLS GRID. Supplied Open House Information is subject to change without notice. All information should be independently reviewed and verified for accuracy. Properties may or may not be listed by the office/agent presenting the information. Some IDX listings have been excluded from this website.IDX information is provided exclusively for personal, non-commercial use, and may not be used for any purpose other than to identify prospective properties consumers may be interested in purchasing. Information is deemed reliable but not guaranteed.
Based on information submitted to the MLS GRID. All data is obtained from various sources and may not have been verified by broker or MLS GRID. Supplied Open House Information is subject to change without notice. All information should be independently reviewed and verified for accuracy. Properties may or may not be listed by the office/agent presenting the information. Some IDX listings have been excluded from this website.IDX information is provided exclusively for personal, non-commercial use, and may not be used for any purpose other than to identify prospective properties consumers may be interested in purchasing. Information is deemed reliable but not guaranteed.
Based on information submitted to the MLS GRID
Ask me questions while you tour the home.