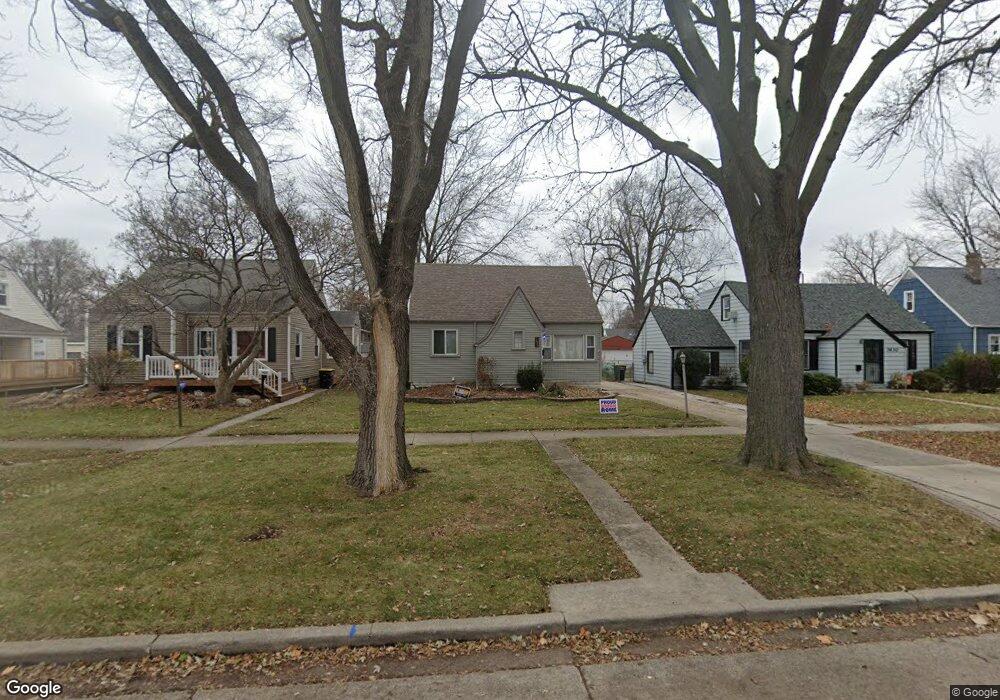
3626 178th St Lansing, IL 60438
Estimated Value: $155,607 - $214,000
3
Beds
2
Baths
1,044
Sq Ft
$177/Sq Ft
Est. Value
About This Home
This home is located at 3626 178th St, Lansing, IL 60438 and is currently estimated at $184,652, approximately $176 per square foot. 3626 178th St is a home located in Cook County with nearby schools including Coolidge Elementary School, Memorial Jr High School, and Thornton Fractnl So High School.
Ownership History
Date
Name
Owned For
Owner Type
Purchase Details
Closed on
Nov 17, 2017
Sold by
Mattera Victoria W
Bought by
Smart John W
Current Estimated Value
Home Financials for this Owner
Home Financials are based on the most recent Mortgage that was taken out on this home.
Original Mortgage
$122,735
Outstanding Balance
$101,459
Interest Rate
3.62%
Mortgage Type
FHA
Estimated Equity
$83,193
Purchase Details
Closed on
Sep 14, 2010
Sold by
Wsh Llc
Bought by
Mattera Victoria W
Purchase Details
Closed on
Apr 24, 2009
Sold by
Grayson Dytice
Bought by
Secretary Of Housing & Urban Development
Purchase Details
Closed on
Jul 30, 2007
Sold by
Mahoney Christina M
Bought by
Grayson Dytice
Home Financials for this Owner
Home Financials are based on the most recent Mortgage that was taken out on this home.
Original Mortgage
$154,714
Interest Rate
6.66%
Mortgage Type
FHA
Create a Home Valuation Report for This Property
The Home Valuation Report is an in-depth analysis detailing your home's value as well as a comparison with similar homes in the area
Home Values in the Area
Average Home Value in this Area
Purchase History
| Date | Buyer | Sale Price | Title Company |
|---|---|---|---|
| Smart John W | $125,000 | Attorney | |
| Smart John W | $125,000 | Attorney | |
| Mattera Victoria W | $38,500 | Stewart Title Company | |
| Wsh Llc | -- | None Available | |
| Mattera Victoria W | $38,500 | Stewart Title Company | |
| Wsh Llc | -- | None Available | |
| Secretary Of Housing & Urban Development | -- | None Available | |
| Secretary Of Housing & Urban Development | -- | None Available | |
| Grayson Dytice | $157,000 | Chicago Title Insurance Co | |
| Grayson Dytice | $157,000 | Chicago Title Insurance Co |
Source: Public Records
Mortgage History
| Date | Status | Borrower | Loan Amount |
|---|---|---|---|
| Open | Smart John W | $122,735 | |
| Previous Owner | Grayson Dytice | $154,714 |
Source: Public Records
Tax History
| Year | Tax Paid | Tax Assessment Tax Assessment Total Assessment is a certain percentage of the fair market value that is determined by local assessors to be the total taxable value of land and additions on the property. | Land | Improvement |
|---|---|---|---|---|
| 2025 | $1,384 | $4,519 | $1,137 | $3,382 |
| 2024 | $1,384 | $4,519 | $1,137 | $3,382 |
| 2023 | $1,551 | $4,519 | $1,137 | $3,382 |
| 2022 | $1,551 | $4,097 | $1,003 | $3,094 |
| 2021 | $1,839 | $4,574 | $1,003 | $3,571 |
| 2020 | $1,774 | $4,574 | $1,003 | $3,571 |
| 2019 | $1,408 | $4,188 | $936 | $3,252 |
| 2018 | $1,380 | $4,188 | $936 | $3,252 |
| 2017 | $1,872 | $5,006 | $936 | $4,070 |
| 2016 | $1,733 | $4,417 | $869 | $3,548 |
| 2015 | $1,578 | $4,417 | $869 | $3,548 |
| 2014 | $1,570 | $4,417 | $869 | $3,548 |
| 2013 | $1,601 | $4,870 | $869 | $4,001 |
Source: Public Records
Map
Nearby Homes
- 3634 178th St
- 17759 Maple St
- 17706 Wentworth Ave
- 17945 Maple St
- 17702 Bernadine St
- 108 Beverly Place
- 7624 Forest Ave
- 17526 Shirley Dr
- 7937 Forest Ave
- 7741 Hohman Ave
- 18052 Wentworth Ave
- 301 Belden Place
- 3238 178th St
- 17926 Roy St
- 17831 Walter St
- 7905 Frederick Ave
- 17519 Community St
- 17946 Roy St
- 17925 Walter St
- 18215 Wentworth Ave Unit 3B
- 3626 178th St
- 3630 178th St
- 3630 178th St
- 3618 178th St
- 3625 177th Place
- 3621 177th Place
- 3629 177th Place
- 3638 178th St
- 3638 178th St
- 3617 177th Place
- 3633 177th Place
- 3642 178th St
- 3642 178th St
- 3613 177th Place
- 3637 177th Place
- 3629 178th St
- 3625 178th St
- 3641 177th Place
- 3621 178th St
- 17755 Wentworth Ave