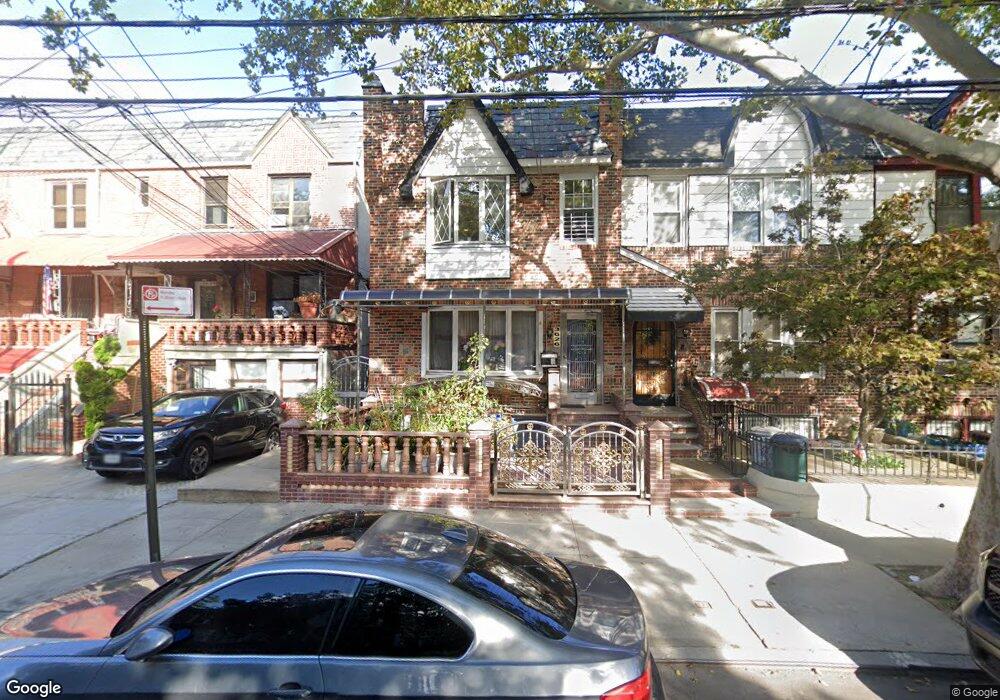
3626 Crescent St Unit 3 Astoria, NY 11106
Long Island City NeighborhoodEstimated Value: $1,466,000 - $1,769,000
--
Bed
--
Bath
2,850
Sq Ft
$544/Sq Ft
Est. Value
About This Home
This home is located at 3626 Crescent St Unit 3, Astoria, NY 11106 and is currently estimated at $1,550,228, approximately $543 per square foot. 3626 Crescent St Unit 3 is a home located in Queens County with nearby schools including P.S. 112 - Dutch Kills, I.S. 204 Oliver W. Holmes, and Long Island City High School.
Ownership History
Date
Name
Owned For
Owner Type
Purchase Details
Closed on
Apr 14, 2008
Sold by
Antonio Marc and Dimarcantonio Anthony
Bought by
Khalique Abdul
Current Estimated Value
Home Financials for this Owner
Home Financials are based on the most recent Mortgage that was taken out on this home.
Original Mortgage
$500,000
Outstanding Balance
$319,429
Interest Rate
6.22%
Mortgage Type
Purchase Money Mortgage
Estimated Equity
$1,230,799
Purchase Details
Closed on
Feb 11, 2002
Sold by
Delaurentis Frank J and De Laurentis Robert
Bought by
Antonio Marc and Di Marcantonio
Home Financials for this Owner
Home Financials are based on the most recent Mortgage that was taken out on this home.
Original Mortgage
$460,000
Interest Rate
6.14%
Mortgage Type
Purchase Money Mortgage
Purchase Details
Closed on
Jun 16, 1997
Sold by
Delaurentis Assunta
Bought by
Delaurentis Frank J and Delaurentis Robert J
Purchase Details
Closed on
Aug 31, 1993
Sold by
Antonio Marc and Dimarcantonio Olga
Bought by
Antonio Marc
Create a Home Valuation Report for This Property
The Home Valuation Report is an in-depth analysis detailing your home's value as well as a comparison with similar homes in the area
Home Values in the Area
Average Home Value in this Area
Purchase History
| Date | Buyer | Sale Price | Title Company |
|---|---|---|---|
| Khalique Abdul | $930,000 | -- | |
| Khalique Abdul | $930,000 | -- | |
| Antonio Marc | $100,000 | -- | |
| Antonio Marc | $100,000 | -- | |
| Delaurentis Frank J | -- | Title Usa Insurance Corp | |
| Delaurentis Frank J | -- | Title Usa Insurance Corp | |
| Antonio Marc | -- | Ticor Title Guarantee Compan | |
| Antonio Marc | -- | Ticor Title Guarantee Compan |
Source: Public Records
Mortgage History
| Date | Status | Borrower | Loan Amount |
|---|---|---|---|
| Open | Khalique Abdul | $500,000 | |
| Closed | Khalique Abdul | $500,000 | |
| Previous Owner | Antonio Marc | $460,000 |
Source: Public Records
Tax History Compared to Growth
Tax History
| Year | Tax Paid | Tax Assessment Tax Assessment Total Assessment is a certain percentage of the fair market value that is determined by local assessors to be the total taxable value of land and additions on the property. | Land | Improvement |
|---|---|---|---|---|
| 2025 | $10,995 | $58,026 | $7,717 | $50,309 |
| 2024 | $10,995 | $54,743 | $7,425 | $47,318 |
| 2023 | $10,795 | $53,746 | $6,191 | $47,555 |
| 2022 | $10,729 | $96,600 | $12,240 | $84,360 |
| 2021 | $10,786 | $84,900 | $12,240 | $72,660 |
| 2020 | $10,235 | $86,760 | $12,240 | $74,520 |
| 2019 | $9,543 | $90,600 | $12,240 | $78,360 |
| 2018 | $9,130 | $44,788 | $6,684 | $38,104 |
| 2017 | $9,130 | $44,788 | $8,172 | $36,616 |
| 2016 | $8,539 | $44,788 | $8,172 | $36,616 |
| 2015 | $5,096 | $40,296 | $10,141 | $30,155 |
| 2014 | $5,096 | $38,016 | $10,212 | $27,804 |
Source: Public Records
Map
Nearby Homes
- 28-07 36th Ave
- 35-35 28th St
- 3529 28th St
- 35-55 29th St Unit 6J
- 35-55 29th St Unit 3D
- 35-40 30th St Unit 1G
- 37-34 28th St
- 36-25 30th St Unit 1F
- 38 ave 27th St
- 3814 27th St
- 35-34 31st St
- 37-24 30th St Unit 2 F
- 36-09 31st St
- 36-11 31st St
- 28-02 34th Ave
- 34-12 29th St
- 21-85 34th Ave Unit 3B
- 36-44 32nd St
- 21-55 34th Ave Unit 3C
- 21-71 34th Ave Unit 15D
- 3626 Crescent St
- 36-26 Crescent St
- 36-26 Crescent St Unit GARDEN
- 3624 Crescent St
- 3628 Crescent St
- 3622 Crescent St
- 36-22 Crescent St Unit 2
- 3630 Crescent St
- 3632 Crescent St
- 3620 Crescent St
- 3634 Crescent St
- 3618 Crescent St
- 3636 Crescent St
- 3616 Crescent St
- 3623 24th St
- 3627 24th St
- 3629 24th St
- 3631 24th St
- 3619 24th St
- 3614 Crescent St