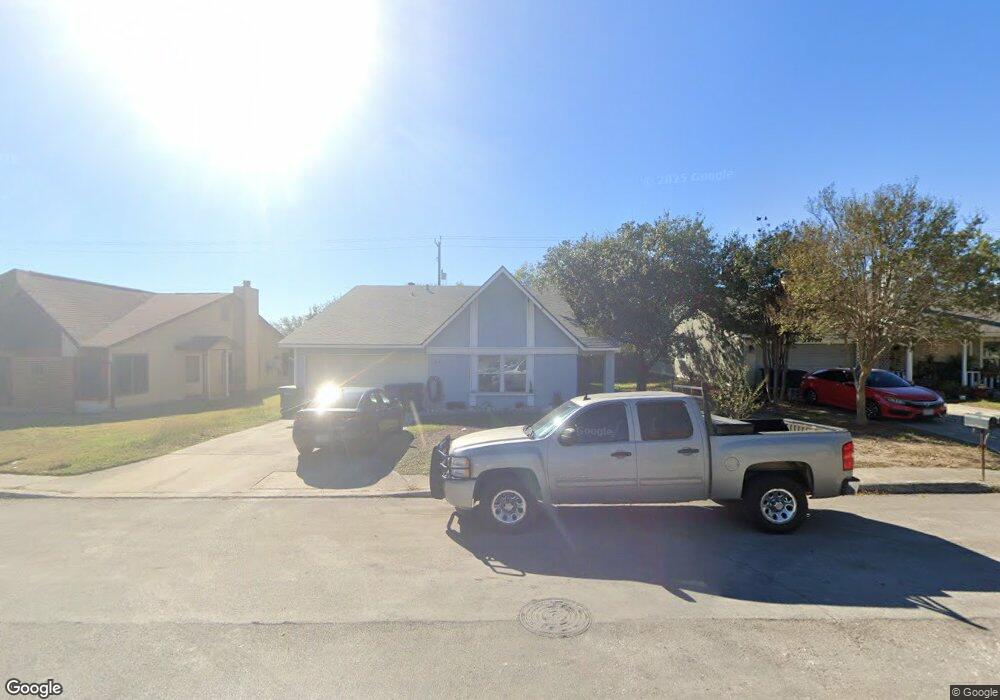
3626 Green Springs Unit 2835615-1606 San Antonio, TX 78247
Thousand Oaks NeighborhoodEstimated Value: $402,000 - $439,000
3
Beds
2
Baths
2,435
Sq Ft
$172/Sq Ft
Est. Value
About This Home
This home is located at 3626 Green Springs Unit 2835615-1606, San Antonio, TX 78247 and is currently estimated at $419,066, approximately $172 per square foot. 3626 Green Springs Unit 2835615-1606 is a home located in Bexar County with nearby schools including Redland Oaks Elementary School, Driscoll Middle School, and MacArthur High School.
Ownership History
Date
Name
Owned For
Owner Type
Purchase Details
Closed on
Oct 26, 2017
Sold by
Thrall Amber Rae
Bought by
Thrall Carleton Matthew
Current Estimated Value
Home Financials for this Owner
Home Financials are based on the most recent Mortgage that was taken out on this home.
Original Mortgage
$50,000
Outstanding Balance
$41,986
Interest Rate
3.93%
Mortgage Type
FHA
Estimated Equity
$377,080
Purchase Details
Closed on
Oct 15, 2014
Sold by
Acosta Gloria Jean
Bought by
Thrall Amber R and Thrall Carleton M
Home Financials for this Owner
Home Financials are based on the most recent Mortgage that was taken out on this home.
Original Mortgage
$206,550
Outstanding Balance
$158,467
Interest Rate
4.12%
Mortgage Type
VA
Estimated Equity
$260,599
Purchase Details
Closed on
Dec 19, 2009
Sold by
Acosta Gloria Jean and Estate Of Cassandra M Smith
Bought by
Acosta Gloria Jean
Create a Home Valuation Report for This Property
The Home Valuation Report is an in-depth analysis detailing your home's value as well as a comparison with similar homes in the area
Home Values in the Area
Average Home Value in this Area
Purchase History
| Date | Buyer | Sale Price | Title Company |
|---|---|---|---|
| Thrall Carleton Matthew | -- | None Available | |
| Thrall Amber R | -- | First American Title | |
| Acosta Gloria Jean | -- | None Available |
Source: Public Records
Mortgage History
| Date | Status | Borrower | Loan Amount |
|---|---|---|---|
| Open | Thrall Carleton Matthew | $50,000 | |
| Open | Thrall Amber R | $206,550 |
Source: Public Records
Tax History Compared to Growth
Tax History
| Year | Tax Paid | Tax Assessment Tax Assessment Total Assessment is a certain percentage of the fair market value that is determined by local assessors to be the total taxable value of land and additions on the property. | Land | Improvement |
|---|---|---|---|---|
| 2025 | -- | $466,590 | $99,600 | $366,990 |
| 2024 | -- | $452,381 | $99,600 | $357,990 |
| 2023 | $9,440 | $411,255 | $99,600 | $328,720 |
| 2022 | $9,225 | $373,868 | $89,200 | $311,890 |
| 2021 | $8,683 | $339,880 | $81,020 | $258,860 |
| 2020 | $8,074 | $311,340 | $72,290 | $239,050 |
| 2019 | $7,980 | $299,630 | $55,180 | $244,450 |
| 2018 | $7,996 | $299,460 | $55,180 | $244,280 |
| 2017 | $7,603 | $282,140 | $55,180 | $226,960 |
| 2016 | $7,438 | $276,012 | $55,180 | $221,020 |
| 2015 | -- | $250,920 | $43,710 | $207,210 |
| 2014 | -- | $199,936 | $0 | $0 |
Source: Public Records
Map
Nearby Homes
- 15606 Bluff Springs St
- 15623 Boulder Creek St
- 3507 Green Spring
- 3414 Ponytail
- 16302 Chuckwagon
- 15511 Elm Park St
- 3314 Trailway Park St
- 3623 Horsemint
- 15318 Preston Pass Dr
- 3807 Pine Breeze Dr
- 3915 Chimney Springs Dr
- 15407 Ivory Hills
- 16415 Old Stable Rd
- 15415 Ivory Hills
- 15238 Preston Pass Dr
- 3906 Gentle Brook
- 16639 Calico Creek Dr
- 16414 Bulverde Point
- 3920 Chimney Springs Dr
- 15314 Fall Place Dr
- 3626 Green Springs Unit 2835619-1606
- 3626 Green Springs Unit 2835622-1606
- 3626 Green Springs Unit 2835617-1606
- 3626 Green Springs Unit 2835621-1606
- 3626 Green Springs Unit 2835616-1606
- 3630 Green Spring
- 3626 Green Spring Dr
- 3626 Green Spring
- 3622 Green Spring Dr
- 3622 Green Spring
- 3619 Boulder Peak St
- 3623 Boulder Peak St
- 3618 Green Spring
- 3634 Green Spring
- 3631 Green Spring
- 3627 Boulder Peak St
- 3631 Green Spring Dr
- 3627 Green Spring
- 3633 Green Spring
- 3615 Boulder Peak St