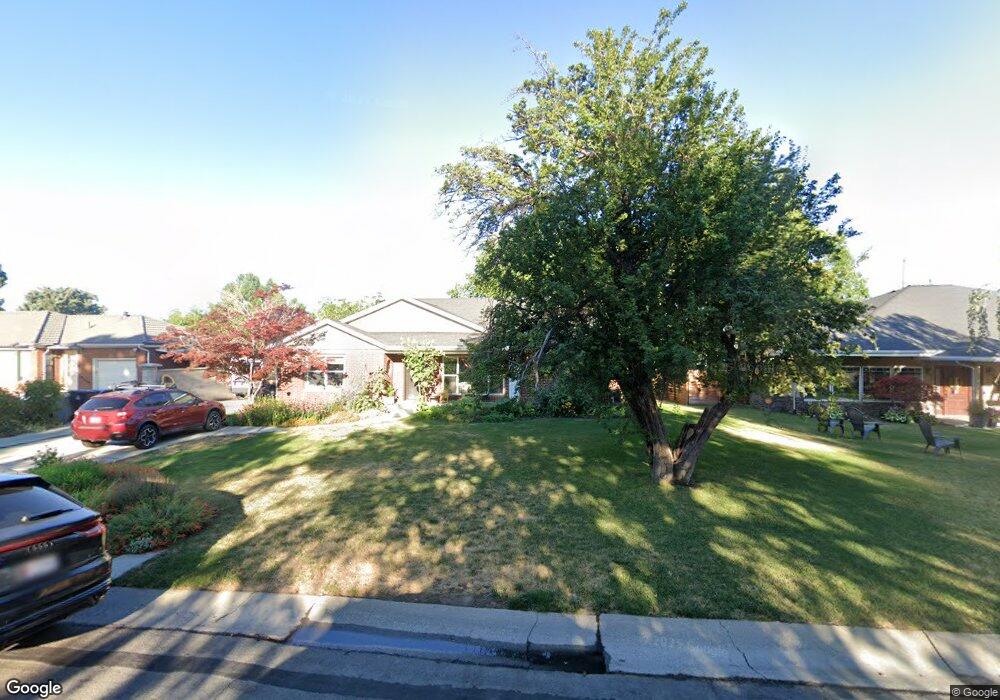
3626 S 2445 E Salt Lake City, UT 84109
East Millcreek NeighborhoodEstimated Value: $970,000 - $1,089,714
4
Beds
3
Baths
1,749
Sq Ft
$583/Sq Ft
Est. Value
About This Home
This home is located at 3626 S 2445 E, Salt Lake City, UT 84109 and is currently estimated at $1,019,179, approximately $582 per square foot. 3626 S 2445 E is a home located in Salt Lake County with nearby schools including Upland Terrace School, Wasatch Junior High School, and Skyline High School.
Ownership History
Date
Name
Owned For
Owner Type
Purchase Details
Closed on
May 10, 2024
Sold by
Pulley Kevin M and Pulley Jennifer W
Bought by
Kevin & Jennifer Pulley Family Trust and Pulley
Current Estimated Value
Purchase Details
Closed on
Mar 24, 2003
Sold by
Mcgill David J and Mcgill Christina A
Bought by
Pulley Kevin M and Pulley Jennifer W
Home Financials for this Owner
Home Financials are based on the most recent Mortgage that was taken out on this home.
Original Mortgage
$180,000
Interest Rate
5.82%
Purchase Details
Closed on
Nov 4, 1997
Sold by
Conradsen Chad Carl
Bought by
Mcgill David J and Mcgill Christina A
Home Financials for this Owner
Home Financials are based on the most recent Mortgage that was taken out on this home.
Original Mortgage
$165,500
Interest Rate
7.26%
Create a Home Valuation Report for This Property
The Home Valuation Report is an in-depth analysis detailing your home's value as well as a comparison with similar homes in the area
Home Values in the Area
Average Home Value in this Area
Purchase History
| Date | Buyer | Sale Price | Title Company |
|---|---|---|---|
| Kevin & Jennifer Pulley Family Trust | -- | None Listed On Document | |
| Pulley Kevin M | -- | Landmark Title | |
| Mcgill David J | -- | First American Title |
Source: Public Records
Mortgage History
| Date | Status | Borrower | Loan Amount |
|---|---|---|---|
| Previous Owner | Pulley Kevin M | $180,000 | |
| Previous Owner | Mcgill David J | $165,500 | |
| Closed | Pulley Kevin M | $19,000 |
Source: Public Records
Tax History Compared to Growth
Tax History
| Year | Tax Paid | Tax Assessment Tax Assessment Total Assessment is a certain percentage of the fair market value that is determined by local assessors to be the total taxable value of land and additions on the property. | Land | Improvement |
|---|---|---|---|---|
| 2025 | $5,464 | $957,300 | $361,800 | $595,500 |
| 2024 | $5,464 | $874,800 | $350,600 | $524,200 |
| 2023 | $4,978 | $769,400 | $330,800 | $438,600 |
| 2022 | $5,116 | $794,800 | $324,300 | $470,500 |
| 2021 | $4,874 | $656,500 | $249,400 | $407,100 |
| 2020 | $4,703 | $597,900 | $245,200 | $352,700 |
| 2019 | $4,613 | $566,000 | $208,900 | $357,100 |
| 2018 | $4,480 | $535,800 | $208,900 | $326,900 |
| 2017 | $3,993 | $500,400 | $208,900 | $291,500 |
| 2016 | $3,827 | $484,100 | $208,900 | $275,200 |
| 2015 | $4,268 | $462,300 | $230,600 | $231,700 |
| 2014 | $3,438 | $398,200 | $219,600 | $178,600 |
Source: Public Records
Map
Nearby Homes
- 2341 E Neffs Ln
- 2525 E Hillside Cir
- 3420 S Pioneer St
- 2346 E 3395 S
- 3916 Olympus Orchards Ln
- 2272 E 3380 S
- 3801 S 2700 E
- 3685 S Craig Cir
- 2559 E Evening Star Dr
- 3983 S Mercury Dr
- 3982 S Saturn Dr
- 3995 S 2280 E
- 2660 E 3300 S Unit A21
- 3835 S 2780 E
- 3404 S 2130 E
- 2871 E Oakridge Dr
- 3356 Colemere Way
- 2379 E 3225 S
- 3973 S 2700 E Unit 2
- 4047 S Comet Cir