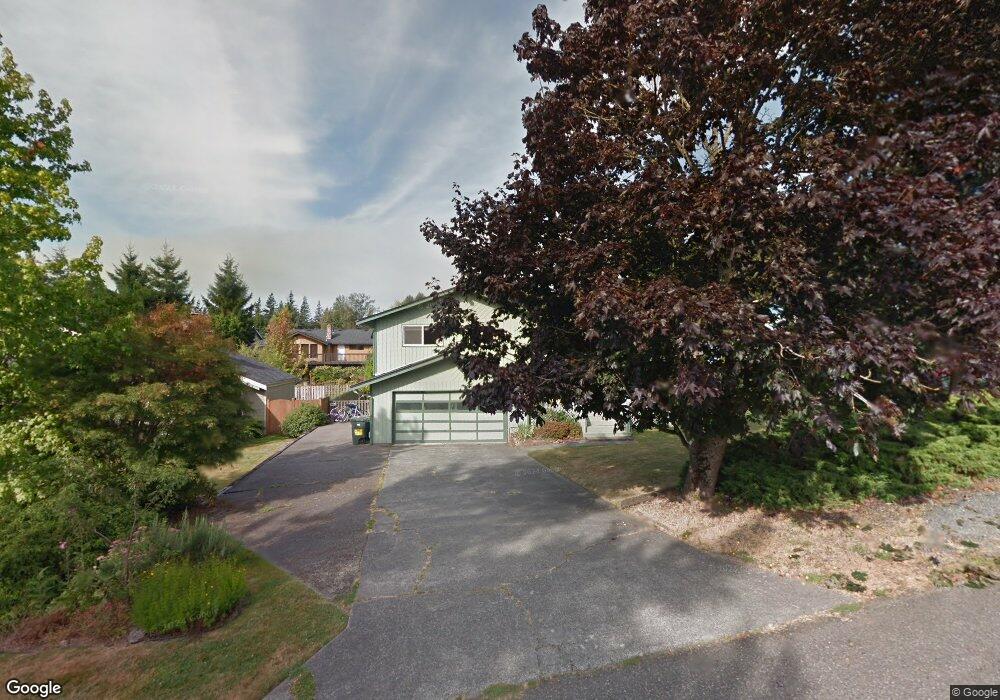
3627 Rusley Ct Bellingham, WA 98225
Birchwood NeighborhoodEstimated Value: $620,000 - $715,000
3
Beds
4
Baths
2,144
Sq Ft
$313/Sq Ft
Est. Value
About This Home
This home is located at 3627 Rusley Ct, Bellingham, WA 98225 and is currently estimated at $670,572, approximately $312 per square foot. 3627 Rusley Ct is a home located in Whatcom County with nearby schools including Alderwood Elementary School, Shuksan Middle School, and Squalicum High School.
Ownership History
Date
Name
Owned For
Owner Type
Purchase Details
Closed on
Oct 29, 2021
Sold by
Lamson Erica V
Bought by
Lamson Erica V and Annett Willaim R
Current Estimated Value
Home Financials for this Owner
Home Financials are based on the most recent Mortgage that was taken out on this home.
Original Mortgage
$186,700
Outstanding Balance
$144,551
Interest Rate
2.15%
Mortgage Type
New Conventional
Estimated Equity
$526,021
Purchase Details
Closed on
Nov 29, 2010
Sold by
Lamson James W and Lamson Pamela R
Bought by
Lamson James W and Lamson Pamela R
Home Financials for this Owner
Home Financials are based on the most recent Mortgage that was taken out on this home.
Original Mortgage
$232,450
Interest Rate
4.77%
Mortgage Type
New Conventional
Purchase Details
Closed on
Aug 22, 2008
Sold by
Lamson James W and Lamson Pamela R
Bought by
The James W Lamson Trust
Purchase Details
Closed on
Jun 19, 2008
Sold by
Davis Scott A and Davis Corrine A
Bought by
Lamson Erica and Vernon Anton G
Home Financials for this Owner
Home Financials are based on the most recent Mortgage that was taken out on this home.
Original Mortgage
$235,875
Interest Rate
5.99%
Mortgage Type
Purchase Money Mortgage
Create a Home Valuation Report for This Property
The Home Valuation Report is an in-depth analysis detailing your home's value as well as a comparison with similar homes in the area
Home Values in the Area
Average Home Value in this Area
Purchase History
| Date | Buyer | Sale Price | Title Company |
|---|---|---|---|
| Lamson Erica V | -- | Chicago Title Company Of Wa | |
| Lamson James W | -- | Lsi North Recording Division | |
| The James W Lamson Trust | -- | None Available | |
| Lamson Erica | $314,780 | First American Title Insuran |
Source: Public Records
Mortgage History
| Date | Status | Borrower | Loan Amount |
|---|---|---|---|
| Open | Lamson Erica V | $186,700 | |
| Closed | Lamson James W | $232,450 | |
| Previous Owner | Lamson Erica | $235,875 |
Source: Public Records
Tax History Compared to Growth
Tax History
| Year | Tax Paid | Tax Assessment Tax Assessment Total Assessment is a certain percentage of the fair market value that is determined by local assessors to be the total taxable value of land and additions on the property. | Land | Improvement |
|---|---|---|---|---|
| 2024 | $4,821 | $593,296 | $218,015 | $375,281 |
| 2023 | $4,821 | $619,384 | $227,601 | $391,783 |
| 2022 | $4,171 | $543,319 | $199,650 | $343,669 |
| 2021 | $3,623 | $449,024 | $165,000 | $284,024 |
| 2020 | $3,502 | $368,152 | $101,251 | $266,901 |
| 2019 | $3,133 | $343,943 | $94,673 | $249,270 |
| 2018 | $3,242 | $308,491 | $84,923 | $223,568 |
| 2017 | $2,819 | $272,955 | $75,140 | $197,815 |
| 2016 | $2,580 | $248,033 | $68,380 | $179,653 |
| 2015 | $2,798 | $236,343 | $65,000 | $171,343 |
| 2014 | -- | $247,956 | $61,920 | $186,036 |
| 2013 | -- | $237,135 | $60,000 | $177,135 |
Source: Public Records
Map
Nearby Homes
- 3635 Home Rd
- 2817 Mcleod Rd
- 3085 W Maplewood Ave
- 0 Home Ln
- 2833 Mcleod Rd
- 3057 Mcleod Rd
- 589 Spring Dr
- 2850 W Maplewood Ave
- 4015 Eliza Ave Unit 31
- 4015 Eliza Ave Unit 120
- 4015 Eliza Ave Unit 47
- 2721 Mcleod Rd
- 2710 Mcleod Rd
- 2829 Cottonwood Ave
- 617 Sunflower Ln Unit E2
- 3350 Northwest Ave Unit 1102
- 3352 Northwest Ave Unit 2101
- 1217 Garland Ln
- 2715 W Maplewood Ave Unit 122
- 2713 W Maplewood Ave Unit 311