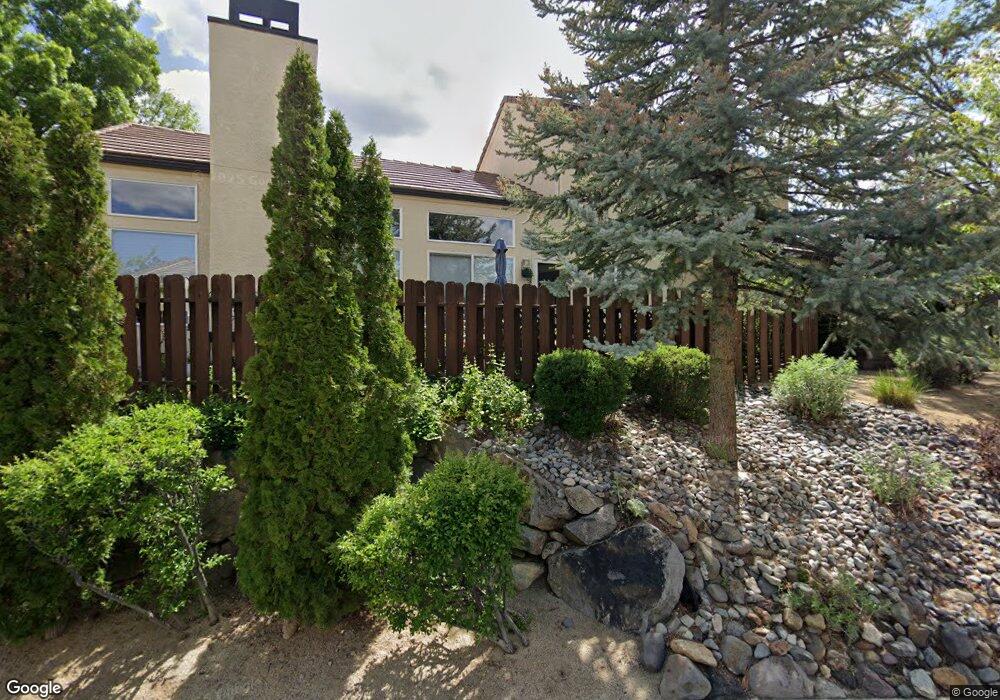
3627 Skyline Blvd Unit 36 Reno, NV 89509
Skyline Boulevard NeighborhoodEstimated Value: $473,000 - $534,000
2
Beds
3
Baths
1,484
Sq Ft
$336/Sq Ft
Est. Value
About This Home
This home is located at 3627 Skyline Blvd Unit 36, Reno, NV 89509 and is currently estimated at $498,963, approximately $336 per square foot. 3627 Skyline Blvd Unit 36 is a home located in Washoe County with nearby schools including Caughlin Ranch Elementary School, Darrell C Swope Middle School, and Reno High School.
Ownership History
Date
Name
Owned For
Owner Type
Purchase Details
Closed on
Feb 22, 2023
Sold by
Green Barbara and Talcott Edward
Bought by
Green Barbara
Current Estimated Value
Purchase Details
Closed on
Jul 31, 2006
Sold by
Altman Mary A
Bought by
Green Barbara J and Talcott Edward C
Home Financials for this Owner
Home Financials are based on the most recent Mortgage that was taken out on this home.
Original Mortgage
$260,000
Interest Rate
6.69%
Mortgage Type
Unknown
Purchase Details
Closed on
Oct 27, 1994
Sold by
Reno Properties Corp
Bought by
Altman Mary A
Home Financials for this Owner
Home Financials are based on the most recent Mortgage that was taken out on this home.
Original Mortgage
$142,900
Interest Rate
8.7%
Create a Home Valuation Report for This Property
The Home Valuation Report is an in-depth analysis detailing your home's value as well as a comparison with similar homes in the area
Home Values in the Area
Average Home Value in this Area
Purchase History
| Date | Buyer | Sale Price | Title Company |
|---|---|---|---|
| Green Barbara | -- | None Listed On Document | |
| Green Barbara J | $325,000 | Ticor Title Of Nevada Inc | |
| Altman Mary A | $159,000 | First Commercial Title Inc |
Source: Public Records
Mortgage History
| Date | Status | Borrower | Loan Amount |
|---|---|---|---|
| Previous Owner | Green Barbara J | $260,000 | |
| Previous Owner | Altman Mary A | $142,900 |
Source: Public Records
Tax History Compared to Growth
Tax History
| Year | Tax Paid | Tax Assessment Tax Assessment Total Assessment is a certain percentage of the fair market value that is determined by local assessors to be the total taxable value of land and additions on the property. | Land | Improvement |
|---|---|---|---|---|
| 2025 | $2,608 | $101,145 | $41,475 | $59,670 |
| 2024 | $2,608 | $94,406 | $33,950 | $60,456 |
| 2023 | $2,533 | $90,528 | $32,970 | $57,558 |
| 2022 | $2,459 | $76,131 | $27,930 | $48,201 |
| 2021 | $2,388 | $70,205 | $22,050 | $48,155 |
| 2020 | $2,315 | $70,734 | $22,260 | $48,474 |
| 2019 | $2,248 | $69,082 | $21,595 | $47,487 |
| 2018 | $2,182 | $62,279 | $15,750 | $46,529 |
| 2017 | $2,120 | $62,369 | $15,645 | $46,724 |
| 2016 | $2,067 | $61,730 | $13,685 | $48,045 |
| 2015 | $2,063 | $60,466 | $12,530 | $47,936 |
| 2014 | $1,973 | $56,209 | $10,605 | $45,604 |
| 2013 | -- | $52,205 | $7,665 | $44,540 |
Source: Public Records
Map
Nearby Homes
- 3601 Skyline Blvd Unit 34
- 3471 Skyline Blvd
- 3445 Skyline Blvd
- 4104 Copper Valley Ln Unit Ascente 17
- 3447 Skyline Blvd
- 3165 Villa Marbella Cir
- 3855 Heavenly Valley Ln
- 3140 Villa Marbella Cir
- 3369 Skyline Blvd
- 3850 Piccadilly Dr
- 3349 Skyline Blvd
- 3875 Gibraltar Dr
- 3030 Blue Grouse Dr Unit 10
- 2593 Chaparral Ct
- 3181 Cashill Blvd
- 2240 Silver Ridge Dr
- 4971 Deer Pass Dr
- 3602 Hemlock Way
- 2536 Meraki Place Unit Lot 07
- 4824 Piney Woods Ct Unit 16
- 3631 Skyline Blvd Unit 37
- 3635 Skyline Blvd
- 3639 Skyline Blvd Unit 39
- 3613 Skyline Blvd
- 3611 Skyline Blvd Unit 22
- 3629 Skyline Blvd Unit 14
- 3625 Skyline Blvd Unit 15
- 3609 Skyline Blvd Unit 23
- 3617 Skyline Blvd Unit 19
- 3643 Skyline Blvd
- 3621 Skyline Blvd Unit 17
- 3607 Skyline Blvd
- 3619 Skyline Blvd Unit 18
- 3637 Skyline Blvd Unit 12
- 3605 Skyline Blvd Unit 25
- 3647 Skyline Blvd
- 3641 Skyline Blvd
- 3645 Skyline Blvd
- 3651 Skyline Blvd Unit 42
- 3487 Skyline Blvd