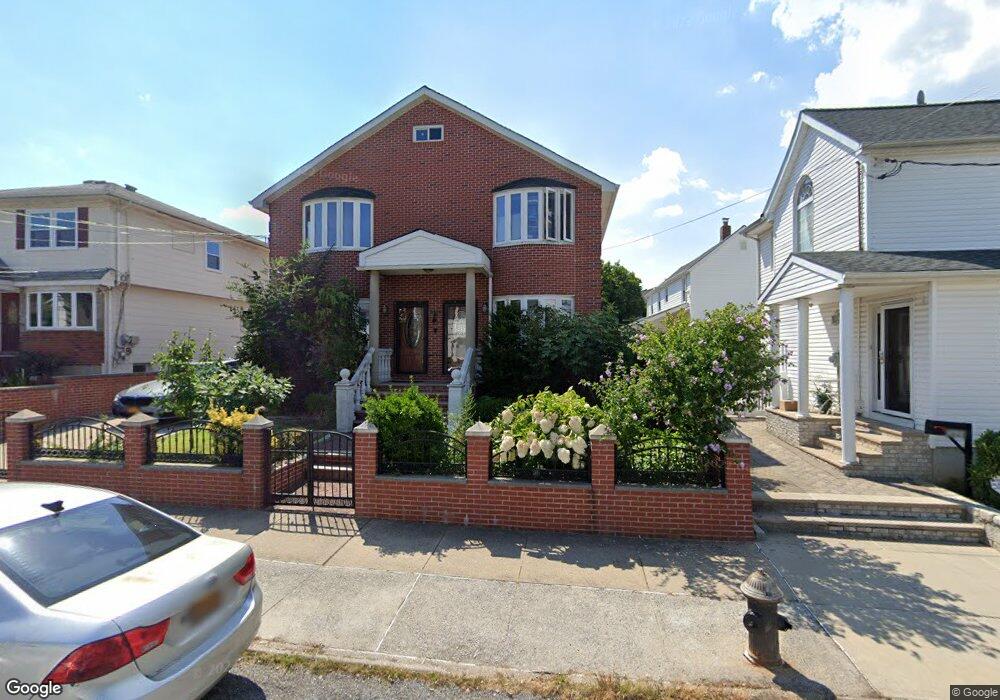
3628 214th Place Bayside, NY 11361
Bayside NeighborhoodEstimated Value: $1,584,000 - $2,459,000
--
Bed
--
Bath
2,752
Sq Ft
$671/Sq Ft
Est. Value
About This Home
This home is located at 3628 214th Place, Bayside, NY 11361 and is currently estimated at $1,846,832, approximately $671 per square foot. 3628 214th Place is a home located in Queens County with nearby schools including P.S. 41 - Crocheron, M.S. 158 - Marie Curie, and Bayside High School.
Ownership History
Date
Name
Owned For
Owner Type
Purchase Details
Closed on
May 18, 2015
Sold by
Yoon Ae Sim and Yoon Joong Hyun
Bought by
Day Peter L and Peng Susan
Current Estimated Value
Home Financials for this Owner
Home Financials are based on the most recent Mortgage that was taken out on this home.
Original Mortgage
$988,000
Outstanding Balance
$759,460
Interest Rate
3.62%
Mortgage Type
Purchase Money Mortgage
Estimated Equity
$1,087,372
Purchase Details
Closed on
Dec 29, 2000
Sold by
Three Eagles Inc
Bought by
Yoon Joong Hyun and Yoon Ae Sim
Home Financials for this Owner
Home Financials are based on the most recent Mortgage that was taken out on this home.
Original Mortgage
$180,000
Interest Rate
7.63%
Mortgage Type
Stand Alone First
Purchase Details
Closed on
Oct 10, 1996
Sold by
Mazurowski Jean
Bought by
Three Eagles Inc
Create a Home Valuation Report for This Property
The Home Valuation Report is an in-depth analysis detailing your home's value as well as a comparison with similar homes in the area
Home Values in the Area
Average Home Value in this Area
Purchase History
| Date | Buyer | Sale Price | Title Company |
|---|---|---|---|
| Day Peter L | $1,418,000 | -- | |
| Yoon Joong Hyun | $380,000 | -- | |
| Three Eagles Inc | -- | -- |
Source: Public Records
Mortgage History
| Date | Status | Borrower | Loan Amount |
|---|---|---|---|
| Open | Day Peter L | $988,000 | |
| Previous Owner | Yoon Joong Hyun | $180,000 |
Source: Public Records
Tax History Compared to Growth
Tax History
| Year | Tax Paid | Tax Assessment Tax Assessment Total Assessment is a certain percentage of the fair market value that is determined by local assessors to be the total taxable value of land and additions on the property. | Land | Improvement |
|---|---|---|---|---|
| 2025 | $13,295 | $70,164 | $12,798 | $57,366 |
| 2024 | $13,295 | $66,192 | $13,678 | $52,514 |
| 2023 | $12,542 | $62,447 | $12,245 | $50,202 |
| 2022 | $11,939 | $99,960 | $18,660 | $81,300 |
| 2021 | $12,587 | $93,780 | $18,660 | $75,120 |
| 2020 | $9,795 | $95,640 | $18,660 | $76,980 |
| 2019 | $8,958 | $96,000 | $18,660 | $77,340 |
| 2018 | $10,608 | $52,039 | $9,779 | $42,260 |
| 2017 | $10,160 | $49,840 | $11,507 | $38,333 |
| 2016 | $9,963 | $49,840 | $11,507 | $38,333 |
| 2015 | $3,814 | $48,725 | $15,120 | $33,605 |
| 2014 | $3,814 | $45,967 | $13,746 | $32,221 |
Source: Public Records
Map
Nearby Homes
- 213-58 35th Ave
- 214-27 38th Ave
- 36-04 215th Place
- 38-30 215th Place
- 36-26 216th St
- 36-24 216th St
- 38-33 215th St
- 38-24 213th St
- 36-30 212th St
- 211-22 34th Rd
- 21135 34th Rd
- 3912 215th Place
- 38-29 216th St
- 39-26 213th St
- 33-19 Bell Blvd
- 33-15 Bell Blvd
- 36-04 210th St
- 217-19 39th Ave
- 33-3 213th St
- 21820 36th Ave
- 3628 214th Place
- 3632 214th Place
- 3624 214th Place
- 3634 214th Place
- 36-27 Corporal Stone St
- 3627 Corporal Stone St
- 3638 214th Place
- 3618 214th Place
- 3623 Corporal Stone St
- 3631 Corporal Stone St
- 3631 Corporal Stone St
- 3631 Corporal Stone St Unit 2 fl
- 3621 Corporal Stone St
- 3629 Corporal Stone St
- 36-33 214th Place Unit 2
- 3619 Corporal Stone St
- 3637 Corporal Stone St
- 3625 214th Place
- 3612 214th Place
- 36-31 214th Place Unit 2