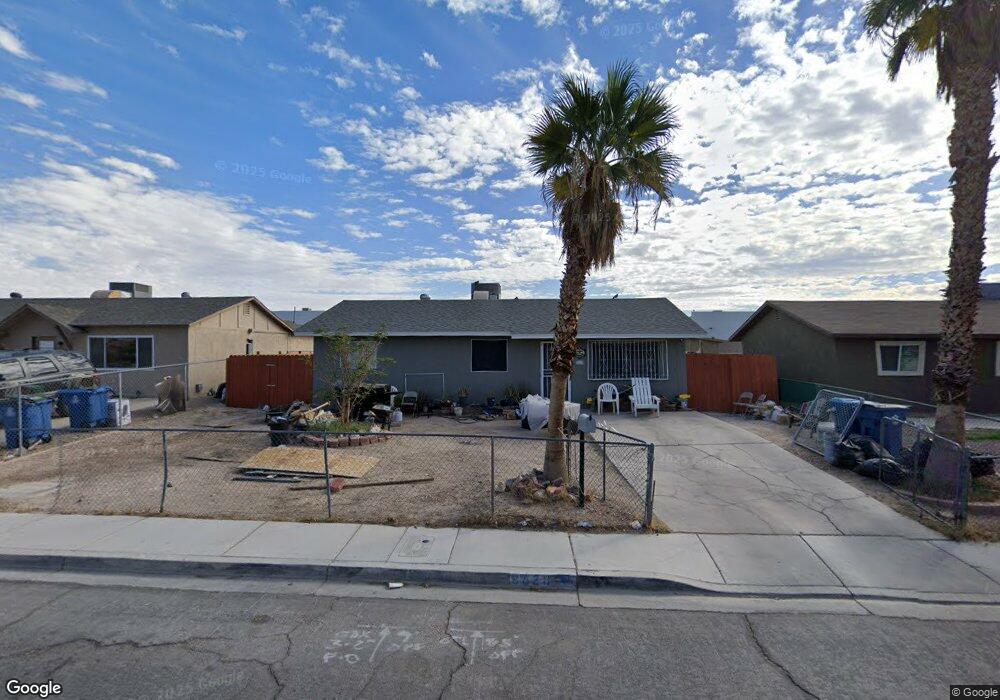
3628 Basin St North Las Vegas, NV 89030
Downtown North Las Vegas NeighborhoodEstimated Value: $211,000 - $276,928
3
Beds
1
Bath
960
Sq Ft
$267/Sq Ft
Est. Value
About This Home
This home is located at 3628 Basin St, North Las Vegas, NV 89030 and is currently estimated at $256,232, approximately $266 per square foot. 3628 Basin St is a home located in Clark County with nearby schools including Lois Craig Elementary School, Marvin M Sedway Middle School, and Canyon Springs High School And The Leadership And.
Ownership History
Date
Name
Owned For
Owner Type
Purchase Details
Closed on
Oct 28, 2020
Sold by
Dowell Roger
Bought by
Delos Santos Samuel Garcia and Garcia Brittany Jeanette
Current Estimated Value
Home Financials for this Owner
Home Financials are based on the most recent Mortgage that was taken out on this home.
Original Mortgage
$129,294
Outstanding Balance
$115,260
Interest Rate
2.9%
Mortgage Type
FHA
Estimated Equity
$140,972
Purchase Details
Closed on
Apr 7, 2012
Sold by
Brown Stephen T and Brown Catherine A
Bought by
Dowell Roger
Purchase Details
Closed on
May 25, 2010
Sold by
Dowell Roger and Dowell Kerry
Bought by
Brown Steve T and Brown Catherine A
Purchase Details
Closed on
Sep 8, 1994
Sold by
Aspinall Winston A and Aspinall Sopit
Bought by
Dowell Roger and Dowell Kerry
Create a Home Valuation Report for This Property
The Home Valuation Report is an in-depth analysis detailing your home's value as well as a comparison with similar homes in the area
Home Values in the Area
Average Home Value in this Area
Purchase History
| Date | Buyer | Sale Price | Title Company |
|---|---|---|---|
| Delos Santos Samuel Garcia | $131,680 | First American Title Insu | |
| Dowell Roger | -- | First American Title Insu | |
| Dowell Roger | $35,085 | None Available | |
| Brown Steve T | $34,000 | Nevada Title Las Vegas | |
| Dowell Roger | $40,000 | Stewart Title |
Source: Public Records
Mortgage History
| Date | Status | Borrower | Loan Amount |
|---|---|---|---|
| Open | Delos Santos Samuel Garcia | $129,294 |
Source: Public Records
Tax History Compared to Growth
Tax History
| Year | Tax Paid | Tax Assessment Tax Assessment Total Assessment is a certain percentage of the fair market value that is determined by local assessors to be the total taxable value of land and additions on the property. | Land | Improvement |
|---|---|---|---|---|
| 2025 | $550 | $37,130 | $24,500 | $12,630 |
| 2024 | $510 | $37,130 | $24,500 | $12,630 |
| 2023 | $362 | $40,096 | $28,700 | $11,396 |
| 2022 | $472 | $32,591 | $22,400 | $10,191 |
| 2021 | $437 | $30,482 | $21,000 | $9,482 |
| 2020 | $403 | $26,730 | $17,500 | $9,230 |
| 2019 | $398 | $23,425 | $14,000 | $9,425 |
| 2018 | $380 | $21,582 | $12,250 | $9,332 |
| 2017 | $679 | $20,241 | $10,500 | $9,741 |
| 2016 | $362 | $17,044 | $6,650 | $10,394 |
| 2015 | $359 | $14,395 | $3,850 | $10,545 |
| 2014 | $348 | $10,079 | $3,850 | $6,229 |
Source: Public Records
Map
Nearby Homes
- 3508 Rio Robles Dr Unit D
- 3508 Rio Robles Dr Unit C
- 3508 Rio Robles Dr Unit A
- 3501 Orvis St
- 3500 Mercury St Unit F
- 3500 Mercury St Unit A
- 3420 Mercury St Unit B
- 3420 Mercury St Unit H
- 3204 Crawford St
- 3417 Civic Center Dr Unit B
- 3535 Mercury St Unit E
- 3923 Via Lucia Dr
- 3523 Mercury St Unit G
- 3412 Mercury St Unit I
- 3505 Mercury St Unit A
- 3505 Mercury St Unit B
- 3505 Mercury St Unit G
- 3244 Figler Ct
- 3540 Purdue
- 3405 Civic Center Dr Unit E
- 3630 Basin St
- 3624 Basin St
- 3629 Belmont St
- 3631 Belmont St
- 3625 Belmont St
- 3632 Basin St Unit 3
- 3620 Basin St
- 3633 Belmont St Unit 3
- 3621 Belmont St
- 3625 Basin St
- 3621 Basin St
- 3627 Basin St
- 3629 Basin St
- 3616 Basin St
- 3617 Belmont St
- 3616 King Charles St
- 3620 King Charles St
- 3700 Basin St
- 2815 Tulane Cir
- 3615 Belmont St